


: Mixed Signals Emerge")

: Short-Term Outlook Continues to Deteriorate")
MARKET REVIEW FOR THE WEEK OF 14-18/10/2024
VN-Index ended the trading week on a downward note, with a rather volatile performance. Investor caution persisted as trading volume remained below the 20-week average. Additionally, the index continued to struggle as it approached the September 2024 peak (equivalent to the 1,290-1,300 point region). In the coming period, a recovery in the index accompanied by improved liquidity could significantly enhance the chances of breaking through this range.
Currently, the MACD indicator is likely to generate a buy signal again after narrowing the gap with the Signal Line. If this occurs, the short-term outlook for the index will show more optimistic signs.
TECHNICAL ANALYSIS
Trend and Price Oscillation Analysis
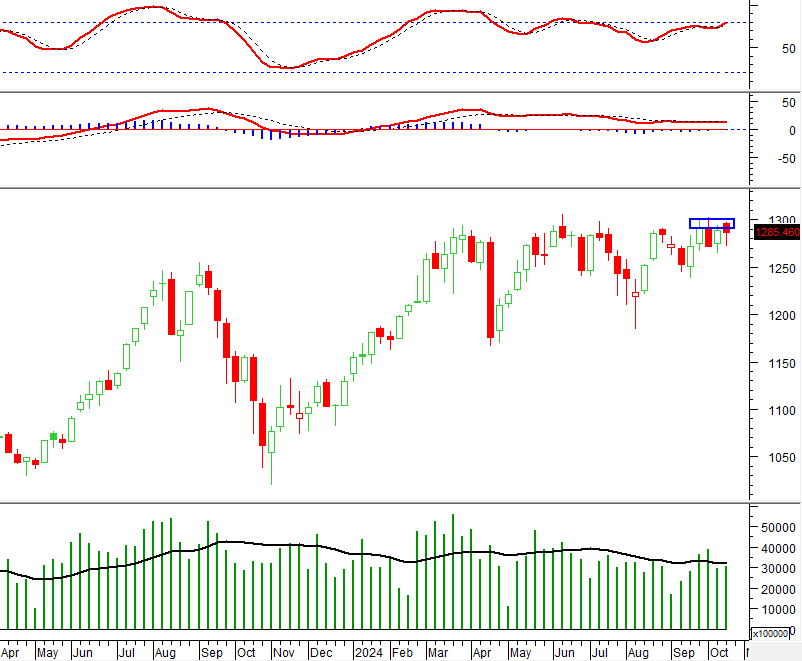
VN-Index – ADX Dips Further Below 20
On 18/10/2024, the VN-Index witnessed a slight decline, with trading volume consistently below the 20-day average, reflecting investors’ cautious sentiment.
Additionally, the index remained above the Middle line of the Bollinger Bands, which are gradually narrowing, while the ADX dipped further below 20. This suggests that the current trend is weak, and the sideway movement is likely to persist.

HNX-Index – High Wave Candle Pattern Emerges
On 18/10/2024, the HNX-Index declined and formed a High Wave Candle pattern, remaining close to the Lower Band of the Bollinger Bands, indicating a rather pessimistic short-term outlook.
However, the index is approaching the April-August 2024 low (equivalent to the 219-226 point region) while the Stochastic Oscillator has entered the oversold territory. If a buy signal reappears and the oscillator climbs out of this region, the chances of a recovery at the low region will increase.

Money Flow Analysis
Smart Money Flow Variation: The Negative Volume Index of the VN-Index crossed above the 20-day EMA. If this condition persists in the next session, the risk of a sudden downturn (thrust down) will diminish.

Foreign Money Flow Variation: Foreign investors continued to sell on 18/10/2024. If this trend continues in subsequent sessions, the situation will become more pessimistic.
Technical Analysis Department, Vietstock Consulting
The Market Beat: The Tug-of-War Continues

As of the market close, the VN-Index dipped 1.06 points (-0.08%), settling at 1,285.46, while the HNX-Index witnessed a decline of 0.91 points (-0.4%), closing at 229.21. The market breadth tilted towards decliners, with 364 stocks falling against 315 advancing stocks. The VN30-Index basket saw a relatively balanced performance, with 13 stocks in the red, 12 in the green, and 5 unchanged.
The Market Beat: Selling Pressure Mounts, VN-Index Dips into the Red

The market closed with the VN-Index down 5.69 points (-0.44%) to 1,279.77 and the HNX-Index down 1.78 points (-0.78%) to 227.43. The market breadth tilted towards decliners with 473 losers and 228 gainers. The large-cap stocks in the VN30-Index basket painted a similar picture, with 23 stocks declining, 5 advancing, and 2 unchanged.
The Market Beat 24/10: Another Day, Another Dive

The market on October 24th delivered a somber day for investors as it witnessed a continuous decline, especially during the afternoon session, ending with a deep slump. A sea of red engulfed the market, with the spotlight on the banking and real estate sectors, dragging down the overall sentiment.
The Rising Pessimism

The VN-Index witnessed a significant decline, forming a bearish Black Marubozu candlestick pattern and breaching the middle line of the Bollinger Bands. The MACD and Stochastic Oscillator indicators continue on a downward trajectory, reinforcing the sell signal. Moreover, persistent foreign net selling sends a cautious message to investors about the market’s outlook in the near term.
The Ultimate Headline:
“Warning Signs: Are Negative Signals Brewing?”

The VN-Index witnessed a significant decline, forming a Black Marubozu candlestick pattern and breaking below the previous low from early October 2024 (around the 1,265-1,270 point level). This strong bearish move reflects the prevailing pessimistic sentiment among investors. Moreover, the trading volume remains below the 20-day average, indicating that buying interest is still limited. The MACD indicator continues to flash a sell signal and has dropped below zero, suggesting that the downward trend is likely to persist in the near term.


