Technical Signals of VN-Index
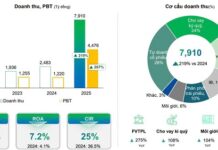
In the trading session on the morning of October 31, 2024, the VN-Index declined, while trading volume saw a slight increase, indicating investors’ uncertainty.
Currently, the VN-Index is retesting the Neckline of a double-top pattern as the MACD indicator continues to trend downward after a previous sell signal. If the index fails to hold this support level, the potential price target is expected to be in the range of 1,225-1,235 points.
Technical Signals of HNX-Index
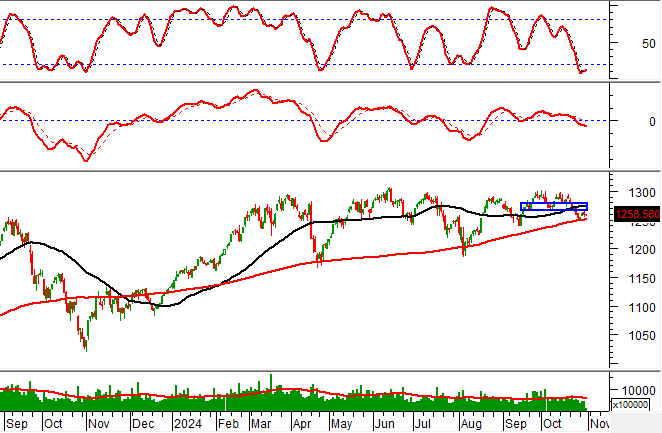
On October 31, 2024, the HNX-Index increased and formed a Doji candlestick pattern, while trading volume slightly decreased, indicating investors’ indecision.
Additionally, the index is retesting its August 2024 low (around 220-225 points) as the Stochastic Oscillator indicator gives a buy signal in the oversold region, suggesting a potential short-term recovery in the upcoming sessions.
ACV – Airports Corporation of Vietnam
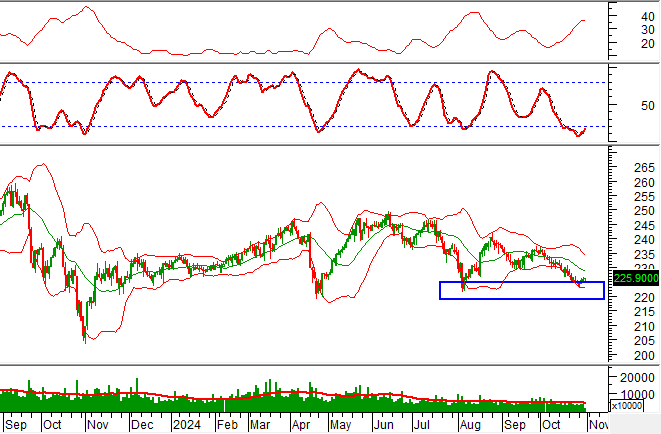
On the morning of October 31, 2024, ACV decreased with a significant rise in trading volume, expected to surpass the 20-day average by the session’s end, reflecting investors’ pessimism.
Currently, the stock price is retesting the Middle line of the Bollinger Bands, while the Stochastic Oscillator indicator gives a sell signal in the overbought region. If the stock price drops below this Middle line, a short-term correction is likely in the near term.
However, the stock price is finding support from the group of SMA 50 and SMA 100 lines, indicating a positive outlook in the medium term.
PVT – Petroleum Transportation Corporation
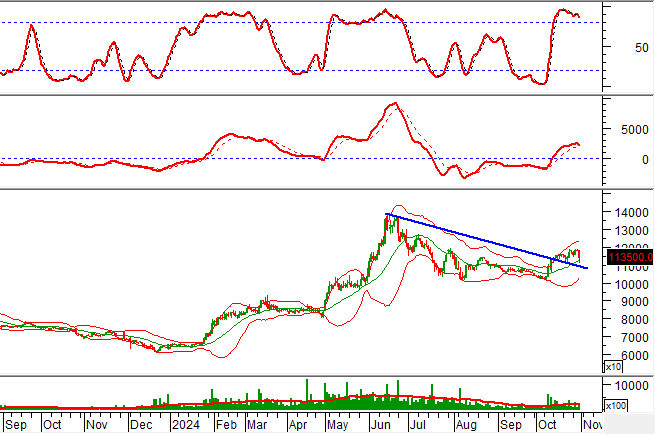
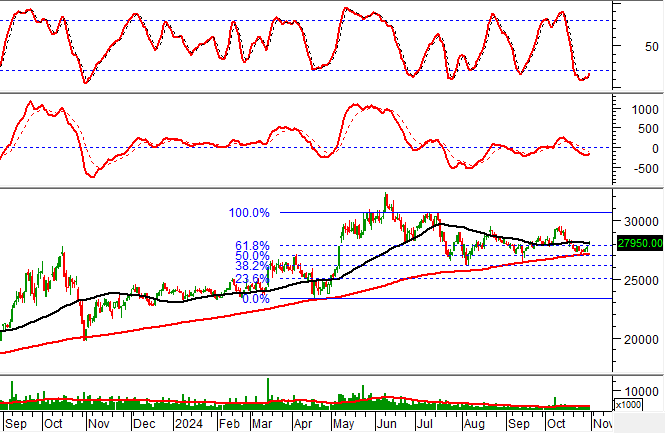
On the morning of October 31, 2024, PVT increased and formed a Rising Window candlestick pattern, with a substantial rise in trading volume, expected to surpass the 20-day average by the session’s end, indicating active trading.
Currently, the stock price is rebounding after retesting the SMA 200-day line, suggesting a maintained positive long-term outlook.
Additionally, the stock price is heading towards testing the 61.8% Fibonacci Projection level (around 27,500-28,500) as the MACD indicator narrows the gap with the Signal line after a previous sell signal. If the indicator gives a buy signal and the stock price successfully surpasses this resistance zone, the potential price target is expected to be in the range of 29,000-30,000.
Technical Analysis Team, Vietstock Consulting
The Cash Flow Conundrum: Unraveling the Divide in Real Estate’s Portfolio.
Market liquidity eased slightly in the past trading week. Money flow indicated a divergence among real estate stocks.
The Market Tug-of-War Rages On
The VN-Index slipped back into the red, despite positive effects from the two recent recovery sessions, indicating that the tug-of-war between bulls and bears is still ongoing. Moreover, trading volume remaining below the 20-day average suggests a lack of returning liquidity in the market. Currently, the MACD and Stochastic Oscillator indicators continue to trend downward, reinforcing bearish signals and dampening short-term prospects.
The Dollar’s Turbulent Ride: A Year-End Review of the Volatile Currency Market
Sharing at the Khớp Lệnh program on October 28, 2024, Mr. Nguyễn Việt Đức, Digital Sales Director of VPBank Securities Joint Stock Company (VPBankS), stated that the exchange rate is currently under significant pressure and has been the main factor hindering the stock market’s performance in recent times. He also highlighted the presence of numerous variables that could come into play towards the end of the year.
The Market Beat: A Surprising Rebound Led by Banking and Real Estate Sectors
The VN-Index staged a strong recovery in the afternoon session, buoyed by gains in the banking and real estate sectors. It closed the day up 5.85 points, or 1.264.48%. The HNX-Index also turned green, rising 0.49 points to 226.36, while the UPCoM-Index edged slightly lower, falling 0.08 points to 92.38.
The Stock Market Optimist: Can We Expect a Revival in Liquidity?
The VN-Index rallied and retested the 100-day SMA. A decisive move above this level, coupled with trading volume surpassing the 20-day average, would reinforce the bullish momentum. Notably, the Stochastic Oscillator has provided a buy signal within the oversold region. If this buy signal persists and the index climbs out of this oversold territory in upcoming sessions, the outlook will turn even more positive.

