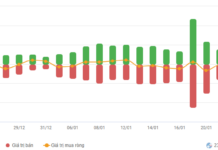
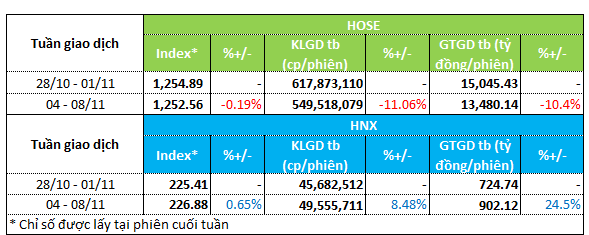
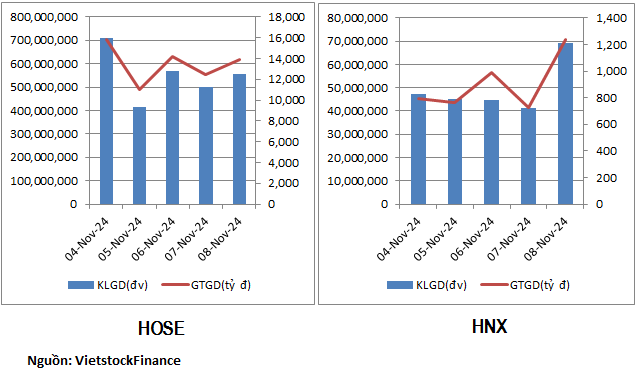
The stock market moved in opposite directions on the HOSE and HNX exchanges during the trading week of November 4-8. On the HOSE floor, the VN-Index edged down 0.2% to 1,252 points. Trading volume and value decreased by about 10% to 550 million units/session and nearly VND13.5 trillion, respectively.
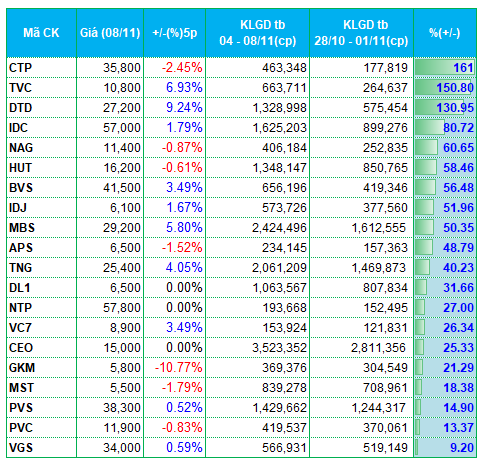
On the other hand, the HNX floor showed an upward trend. The HNX-Index rose 0.6% to 226.88 points. The average volume increased by 9% to 49.5 million units/session, while the average value of transactions rose by 24.5% to VND902 billion/session.
|
Market Liquidity Overview for the Week of November 4-8
|
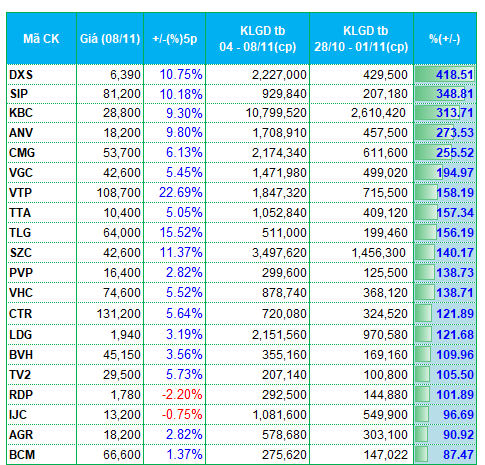
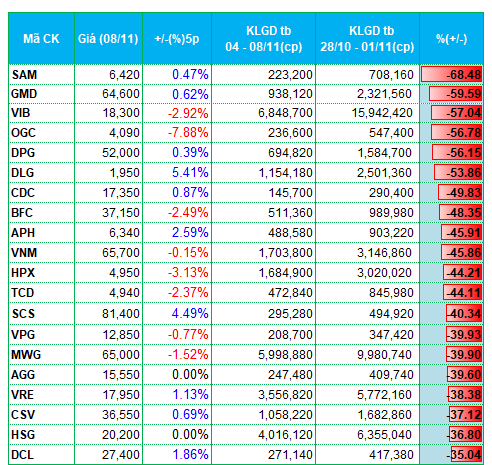
Last week, capital flow showed a positive trend in industrial real estate stocks. A series of stocks in this group, including SIP, KBC, SZC, BCM, and IDC, were among the most actively traded on the HOSE floor. Notably, the trading volume of SIP and KBC surged by over 300%, accompanied by a strong increase in their share prices of approximately 10%.
Other stocks, such as SZC, BCM, and IDC, also witnessed substantial improvements in liquidity, with their trading volumes increasing by 90%-140%.
The news of Donald Trump’s election victory last week had a positive impact on industrial real estate stocks. This sector is expected to benefit from the policies of the US during Trump’s presidency.
Additionally, some securities stocks also recorded notable improvements in liquidity. AGR, TVC, BVS, MBS, and APS saw their trading volumes increase by 50%-90%.
The residential real estate sector experienced mixed capital flows. A string of stocks, including DXS, DTD, IDJ, and CEO, witnessed strong increases in liquidity. In contrast, many codes, such as OGC, CDC, HPX, AGG, VRE, PV2, NRC, faced capital outflows.
On the downside, capital outflow was observed in some sectors, including transportation (GMD, SCS, and DXP experiencing decreased liquidity) and construction (DPG, TCD, C69, VC2, and LIG witnessing a 20%-50% decline in trading volume).
|
Top 20 codes with the highest increase/decrease in liquidity on the HOSE floor
|
|
Top 20 codes with the highest increase/decrease in liquidity on the HNX floor
|
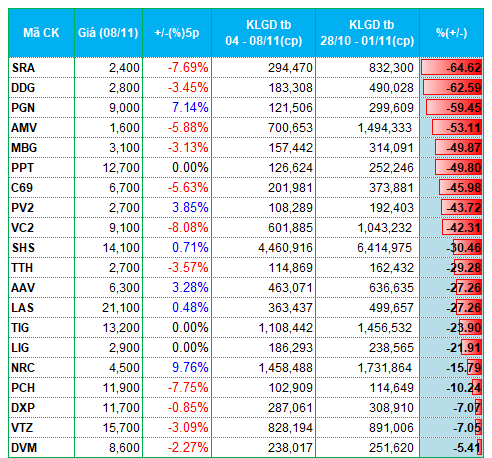
The list of codes with the highest increase/decrease in liquidity is based on a minimum average trading volume of 100,000 units/session.
SSI Research: Short-term Volatility Presents Buying Opportunities for Long-term Investors
“According to SSI Securities Corporation’s November 2024 strategy report, the SSI Research Center for Analysis and Investment Consulting believes that the market may fluctuate in the short term. However, this also presents an opportunity to buy potential stocks at reasonable prices to build a long-term investment portfolio.”
The Looming Threat of a Market Downturn: Navigating the Risks Ahead
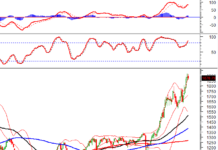
The VN-Index witnessed its fourth consecutive session of losses, dipping below the 200-day SMA. This downward trend indicates a negative shift in market sentiment. Accompanying this decline is a drop in trading volume below the 20-day average, reflecting heightened investor caution. The MACD indicator continues to plummet, reinforcing the sell signal and suggesting that the short-term outlook remains pessimistic.
Foreign Sell-Off Continues in Session 6/11: Over 450 Billion Dong Liquidated, Which Stocks Took the Biggest Hit?
The foreign transactions were less than enthusiastic, as they heavily net sold on the HOSE and HNX exchanges.

