I. MARKET ANALYSIS OF STOCK MARKET BASICS ON 11/11/2024
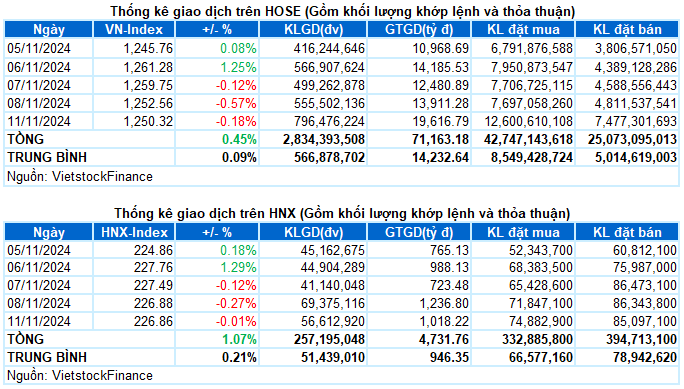
– The main indices fell in the trading session on 11/11. VN-Index closed the session down 0.18%, at 1,250.32 points; HNX-Index stopped at the reference mark, reaching 226.86 points, down 0.01% from the previous session.
– Matching volume on HOSE exceeded 712 million units, up 41.5% from the previous session. Matching volume on HNX increased by 11.1%, reaching nearly 50 million units.
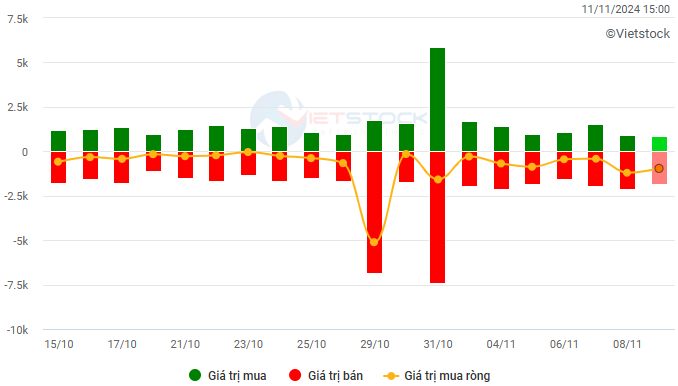
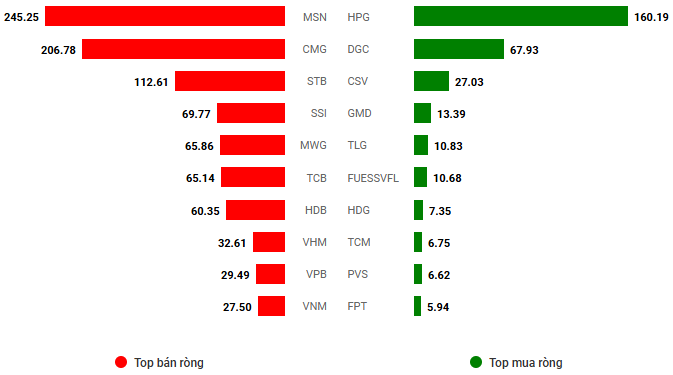
– Foreigners continued to sell a net on the HOSE floor with a value of more than 960 billion VND and net sold more than 4 billion VND on the HNX floor.
Trading value of foreign investors on HOSE, HNX and UPCOM by day. Unit: Billion VND
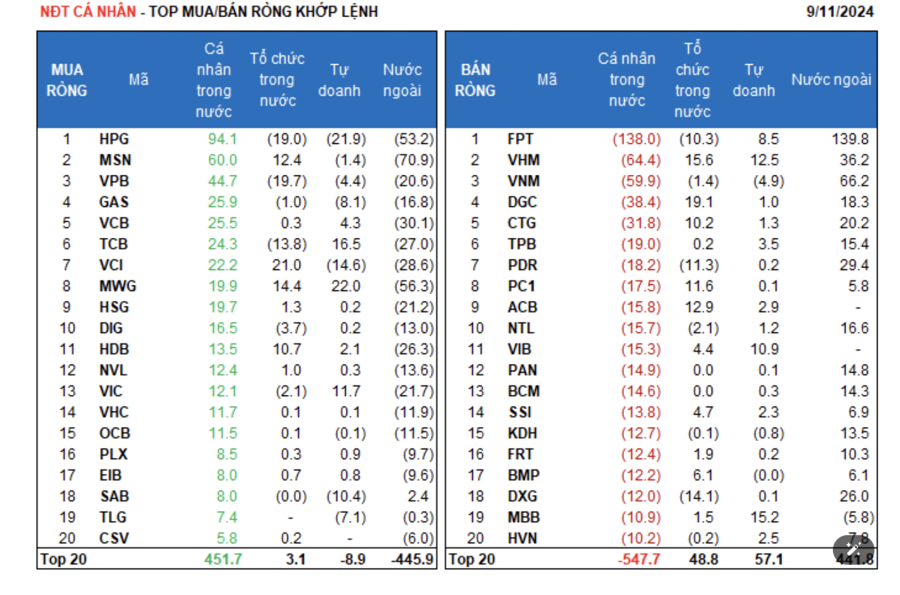
Net trading value by stock code. Unit: Billion VND
– The stock market had a difficult start to the week. Strong pressure from the group of pillar stocks, especially banks, caused VN-Index to lose nearly 8 points at the end of the morning session, despite more than half of the sectors still holding the green color. Entering the afternoon session, the recovery efforts were quite noticeable, low-priced demand helped narrow the decline of the general index towards the end of the session. VN-Index closed the trading session on 11/11 at 1,250.32 points, down 2.24 points from the previous session.
– In terms of impact, 9/10 stocks with the most negative impact on the index today belonged to the banking group, led by BID and STB, taking away 2 points from VN-Index. On the contrary, the remarkable efforts of HPG and FPT helped the general index regain more than 2 points. In addition, VHM and MSN also reversed successfully in the afternoon session, contributing more than 1 point to the recovery of VN-Index.
– VN30-Index closed down 0.52%, to 1,310.46 points. Sellers dominated with 19 codes decreasing, 10 codes increasing, and 1 code standing at the reference price. Of which, STB plunged the strongest, down nearly 5%. This was followed by MWG, TPB, HDB and PLX, which also fell by around 2-3%. On the other hand, among the 10 rising stocks, 7/10 stocks increased by more than 1%. HPG traded positively from the beginning of the session, leading with a 2.6% increase.
Although only 3/11 sectors decreased, the general index still could not recover. These 3 groups include energy, non-essential consumption, and finance, all down more than 1%. In particular, the “king stocks” – accounting for about 30% of the market capitalization – were the main reason for today’s decline. Red dominated widely, typically STB (-4.79%), MSB (-2.92%), TPB (-2.7%), HDB (-2.67%), NVB (-2.27%), BID (-1.9%), TCB (-1.69%), VPB (-1.54%), LPB (-1.4%) and MBB (-1.02%). In addition, large-cap stocks that fell significantly in the remaining two sectors were BSR (-1.42%), PVS (-0.78%), PVD (-0.59%); MWG (-3.08%), PLX (-2%), GEE (-1.49%),…
In contrast, the information technology group led the market with an increase of more than 2%. This was mainly contributed by the two giants FPT (+1.84%) and CMG hitting the ceiling price. Following was the industrial group, up 1.77%. Transport stocks in this group continued to shine, attracting positive cash flow such as MVN, VOS, VTO, VIP in brilliant purple, SGP (+8.64%), HVN (+4.23%), VSC (+3.24%), HAH (+2.29%) and ACV (+1.17%).
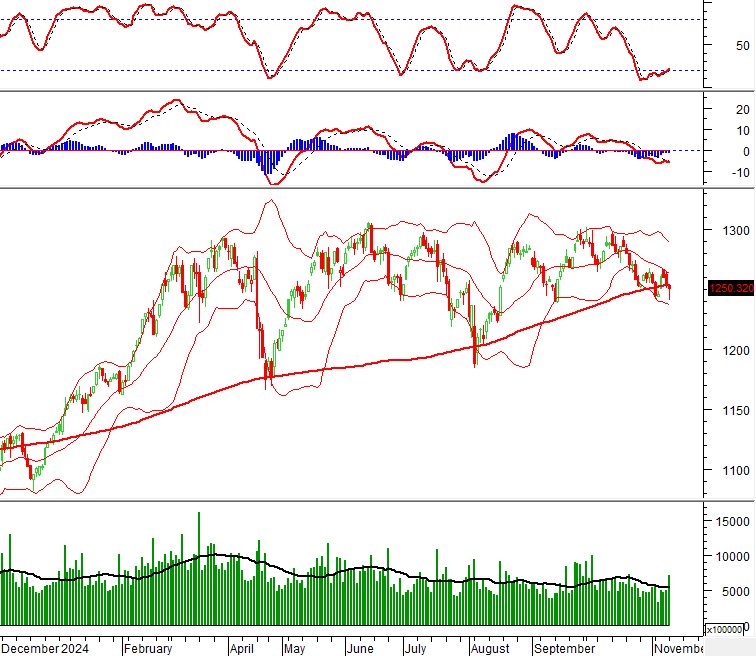
VN-Index narrowed its decline with the appearance of a Hammer candlestick pattern accompanied by volume exceeding the 20-day average. This suggests that market risk has temporarily eased as bottom-fishing cash flow appears with a surge in trading volume. Currently, the Stochastic Oscillator indicator continues to give a buy signal after exiting the oversold zone. If this signal is maintained in the coming sessions, the short-term outlook will not be too pessimistic.
II. TREND AND PRICE MOVEMENT ANALYSIS
VN-Index – Hammer Candlestick Pattern Appears
VN-Index narrowed its decline with the appearance of a Hammer candlestick pattern accompanied by volume exceeding the 20-day average. This suggests that market risk has temporarily eased as bottom-fishing cash flow appears, causing a surge in trading volume.
Currently, the Stochastic Oscillator indicator continues to give a buy signal after exiting the oversold zone. If this signal is maintained in the coming sessions, the short-term outlook will not be too pessimistic.
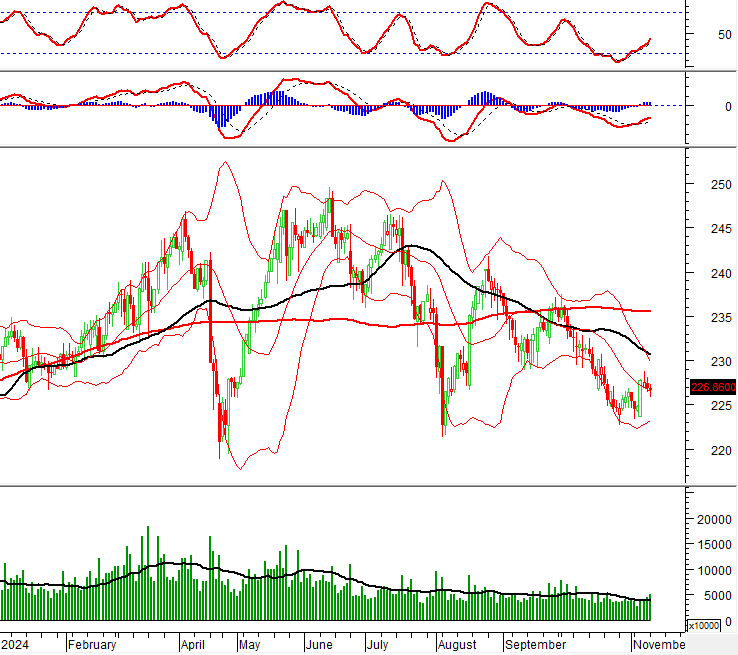
HNX-Index – Maintaining Above Middle Bollinger Bands
HNX-Index edged slightly lower while staying above the Middle Bollinger Bands. If the index continues to stay above this threshold in the coming days, the situation will not be too pessimistic. In addition, trading volume above the 20-day average indicates that money is still flowing into the market.
Currently, the Stochastic Oscillator and MACD indicators both give buy signals again. If this signal is maintained in the coming sessions, the risk of further declines will not be too large.
Analysis of Money Flow
Fluctuations in Smart Money Flow: The Negative Volume Index indicator of VN-Index cut down below the EMA 20 day line. If this state continues in the next session, the risk of a sudden drop (thrust down) will increase.
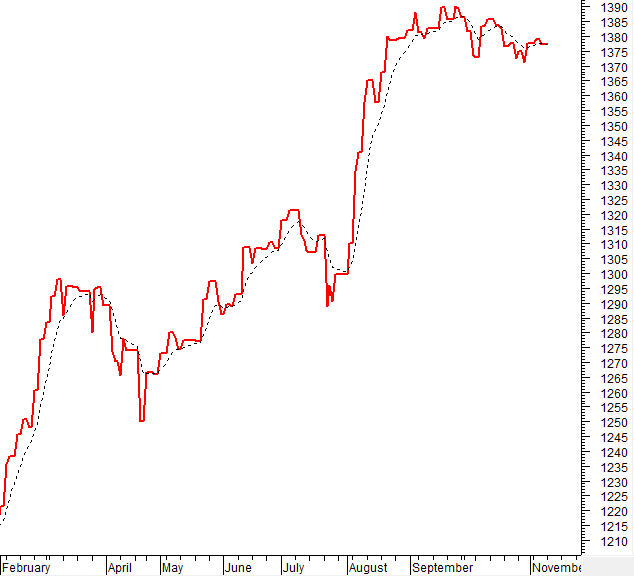
Fluctuations in Foreign Money Flow: Foreigners continued to net sell in the trading session on 11/11/2024. If foreign investors maintain this action in the coming sessions, the situation will be more pessimistic.
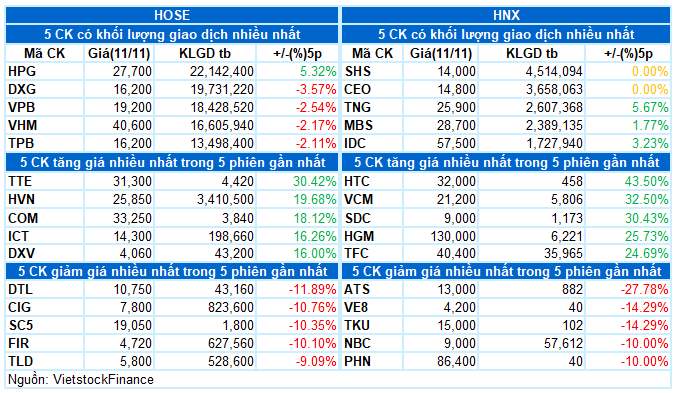
III. MARKET STATISTICS ON 11/11/2024
Economic Analysis and Market Strategy Department, Vietstock Consulting


