I. STOCK MARKET ANALYSIS FOR NOVEMBER 11, 2024
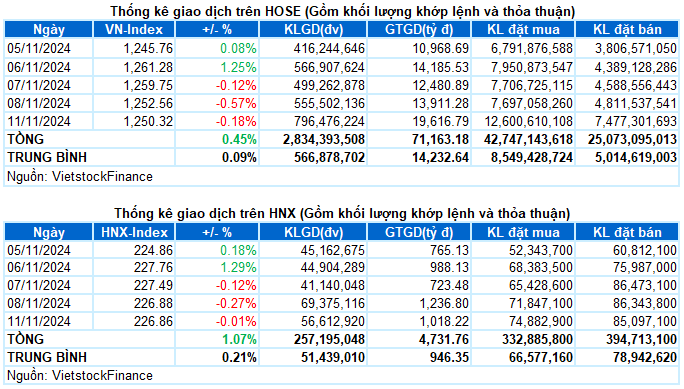
– Key indices witnessed a decline during the trading session on November 11. The VN-Index closed 0.18% lower at 1,250.32, while the HNX-Index barely held the reference mark, ending at 226.86, down 0.01% from the previous session.
– Trading volume on the HOSE exceeded 712 million units, a 41.5% increase compared to the previous session. On the HNX, trading volume rose 11.1% to nearly 50 million units.
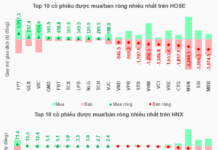
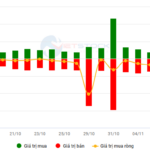
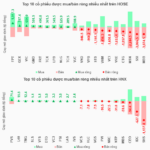
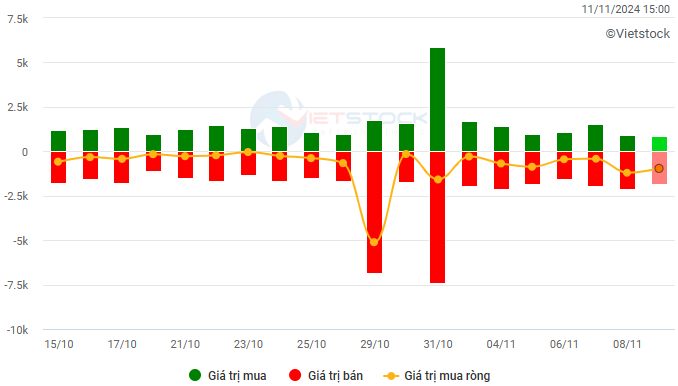
– Foreign investors continued to offload stocks on the HOSE, with a net sell value of over 960 billion VND, and net sold more than 4 billion VND on the HNX.
Trading value of foreign investors on HOSE, HNX, and UPCOM for November 11, 2024. Unit: Billion VND
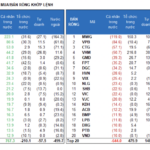
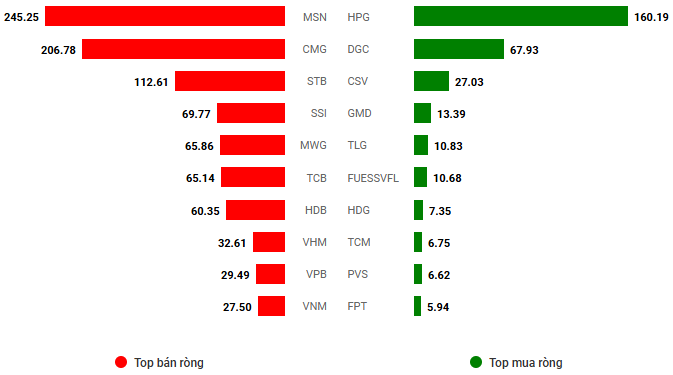
Net trading value by stock. Unit: Billion VND
– The stock market faced challenges at the start of the week. Significant pressure from large-cap stocks, especially banks, caused the VN-Index to lose nearly 8 points by the end of the morning session, despite more than half of the sectors remaining in positive territory. In the afternoon session, notable recovery efforts were observed, with buying support at lower prices helping to narrow the decline towards the end of the day. The VN-Index closed the November 11 trading session at 1,250.32, down 2.24 points from the previous day.
– In terms of impact, 9 out of 10 stocks with the most negative influence on the index belonged to the banking group, led by BID and STB, which took away 2 points from the VN-Index. On the other hand, the remarkable performance of HPG and FPT helped the index recoup over 2 points. Additionally, VHM and MSN also successfully reversed their trends in the afternoon session, contributing over 1 point to the VN-Index’s recovery.
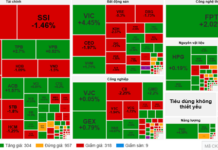
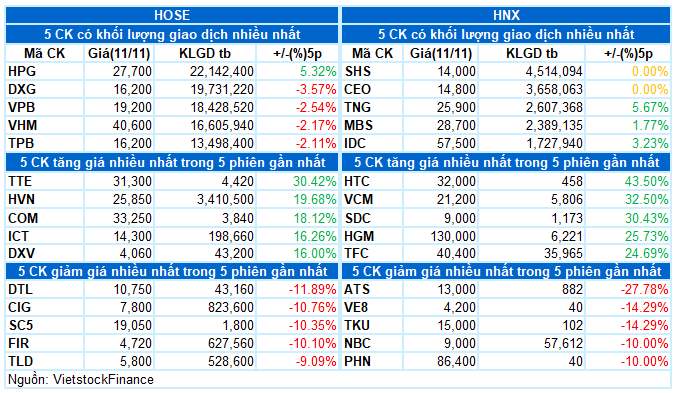
– The VN30-Index fell 0.52% to 1,310.46. Sellers dominated with 19 declining stocks, 10 advancing stocks, and 1 unchanged stock. Among them, STB plunged nearly 5%. This was followed by MWG, TPB, HDB, and PLX, which declined by around 2-3%. Conversely, out of the 10 advancing stocks, 7 rose by more than 1%. HPG traded positively from the beginning of the session, leading with a 2.6% gain.
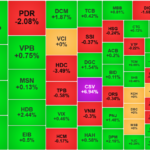
Despite only 3 out of 11 sectors posting losses, the overall index failed to recover. These three sectors included energy, non-essential consumer goods, and finance, all declining by over 1%. Notably, the “king stocks,” which account for about 30% of the market capitalization, were the main contributors to today’s decline. Red dominated the large-cap stocks, notably STB (-4.79%), MSB (-2.92%), TPB (-2.7%), HDB (-2.67%), NVB (-2.27%), BID (-1.9%), TCB (-1.69%), VPB (-1.54%), LPB (-1.4%), and MBB (-1.02%). Additionally, notable decliners in the other two sectors included BSR (-1.42%), PVS (-0.78%), PVD (-0.59%); MWG (-3.08%), PLX (-2%), GEE (-1.49%), and others.
In contrast, the information technology group led the market with a gain of over 2%. This was mainly driven by the two large-cap stocks, FPT (+1.84%) and CMG, which hit the ceiling price. Following closely was the industrial sector, which increased by 1.77%. Transportation stocks within this group continued to shine, attracting positive buying interest, such as MVN, VOS, VTO, and VIP, which turned purple, along with SGP (+8.64%), HVN (+4.23%), VSC (+3.24%), HAH (+2.29%), and ACV (+1.17%).
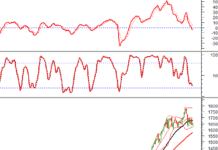
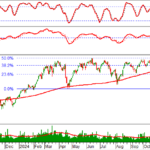
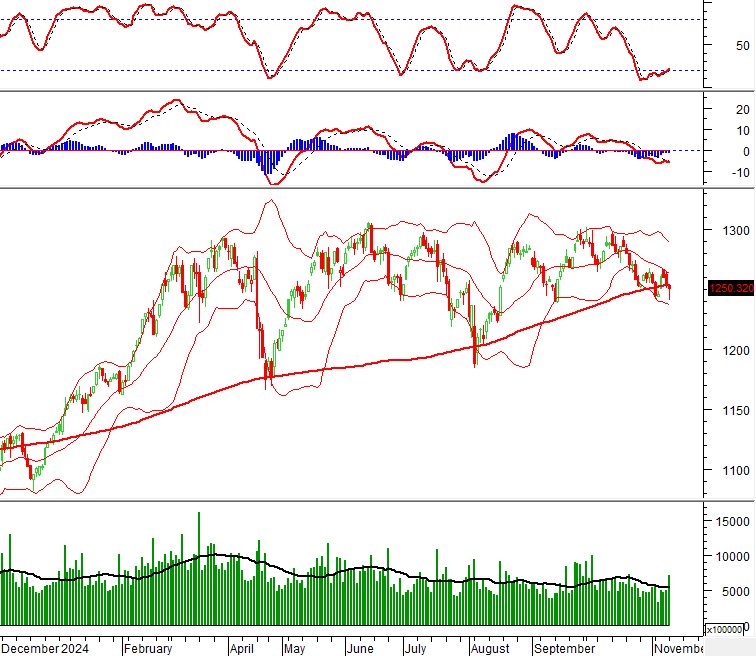
The VN-Index narrowed its loss with the emergence of a Hammer candlestick pattern, accompanied by volume surpassing the 20-day average. This suggests that market risks have temporarily eased as bottom-fishing funds entered the market, evident in the surge in trading volume. Currently, the Stochastic Oscillator indicator continues to give a buy signal after exiting the oversold region. If this signal is maintained in the coming sessions, the short-term outlook may not be overly pessimistic.
II. TREND AND PRICE MOVEMENT ANALYSIS
VN-Index – Hammer Candlestick Pattern Emerges
The VN-Index narrowed its decline with the emergence of a Hammer candlestick pattern, accompanied by volume surpassing the 20-day average. This suggests that market risks have temporarily eased as bottom-fishing funds entered the market.
At present, the Stochastic Oscillator indicator continues to give a buy signal after exiting the oversold region. If this signal is sustained in the upcoming sessions, the short-term outlook may not be overly pessimistic.
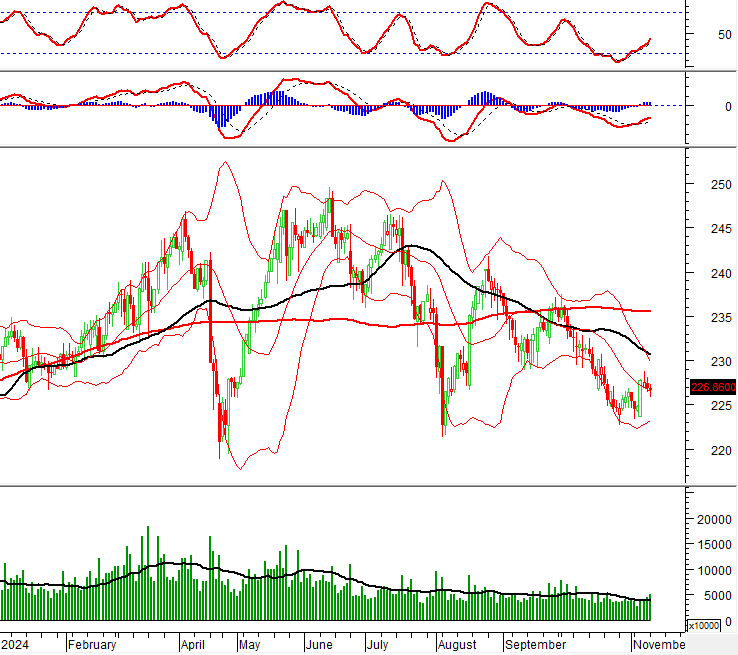
HNX-Index – Maintains Above Middle Bollinger Band
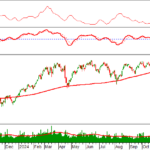
The HNX-Index witnessed a slight decline while staying above the Middle Bollinger Band. If the index continues to hold above this threshold in the coming days, the situation may not be overly pessimistic. Moreover, trading volume exceeded the 20-day average, indicating that money is still flowing into the market.
Presently, the Stochastic Oscillator and MACD indicators both provide buy signals. If these signals are sustained in the upcoming sessions, the risk of further declines may not be significant.
Money Flow Analysis
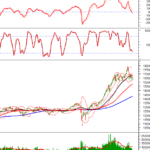
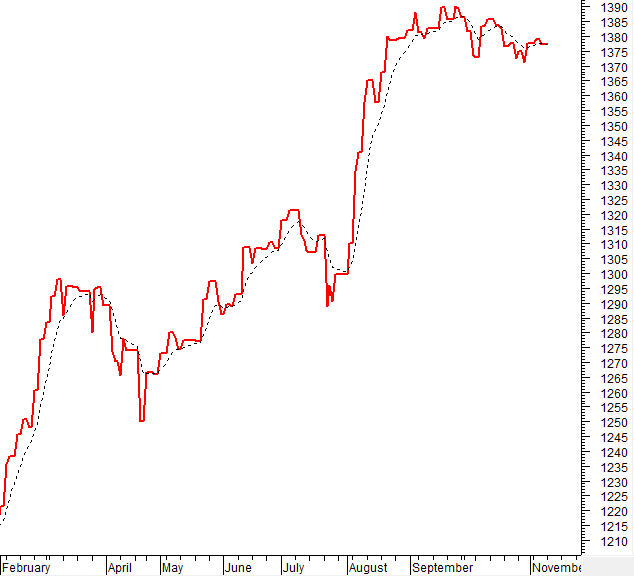
Movement of Smart Money: The Negative Volume Index indicator for the VN-Index fell below the EMA 20-day moving average. If this state persists in the next session, the risk of a sudden downturn (thrust down) will increase.
Foreign Capital Flow: Foreign investors continued to net sell during the trading session on November 11, 2024. If foreign investors maintain this action in the coming sessions, the outlook may turn more pessimistic.
III. MARKET STATISTICS FOR NOVEMBER 11, 2024
Analysis and Strategy Department, Vietstock Research Team
The Savvy Investor’s Bottom-fishing Expedition
The VN-Index pared losses, forming a Hammer candlestick pattern with above-average volume. This indicates a temporary reprieve from market risks as bottom-fishing funds entered the market, spurring a surge in trading volume. The Stochastic Oscillator, having exited oversold territory, continues to signal a buy. If this signal holds in the coming sessions, the short-term outlook may not be as pessimistic.
The Big Deal with MSN: Foreigners Net Sell nearly VND 1,600 billion
Foreign investors sold a net amount of 1,584.2 billion VND, and they sold a net of 497.0 billion VND in matched orders.
The Surprising Surge of Penny Stocks: A Market Phenomenon
Liquidity saw a significant improvement during the afternoon session; however, funds did not largely flow into the blue-chip stocks. It was the mid-cap and small-cap stocks that witnessed a surge as the liquidity in the mid-cap group increased by 37% compared to the previous day, while the small-cap group witnessed a remarkable 44% increase, leaving the VN30 with just a 14% gain.
Technical Analysis for the Afternoon Session of November 12th: A Notable Drop in Liquidity
The VN-Index and HNX-Index moved in opposite directions, forming a Doji candlestick pattern, indicating investor indecision and a potential turning point in the market.

