MARKET REVIEW FOR THE WEEK OF 11/11/2024 – 11/15/2024
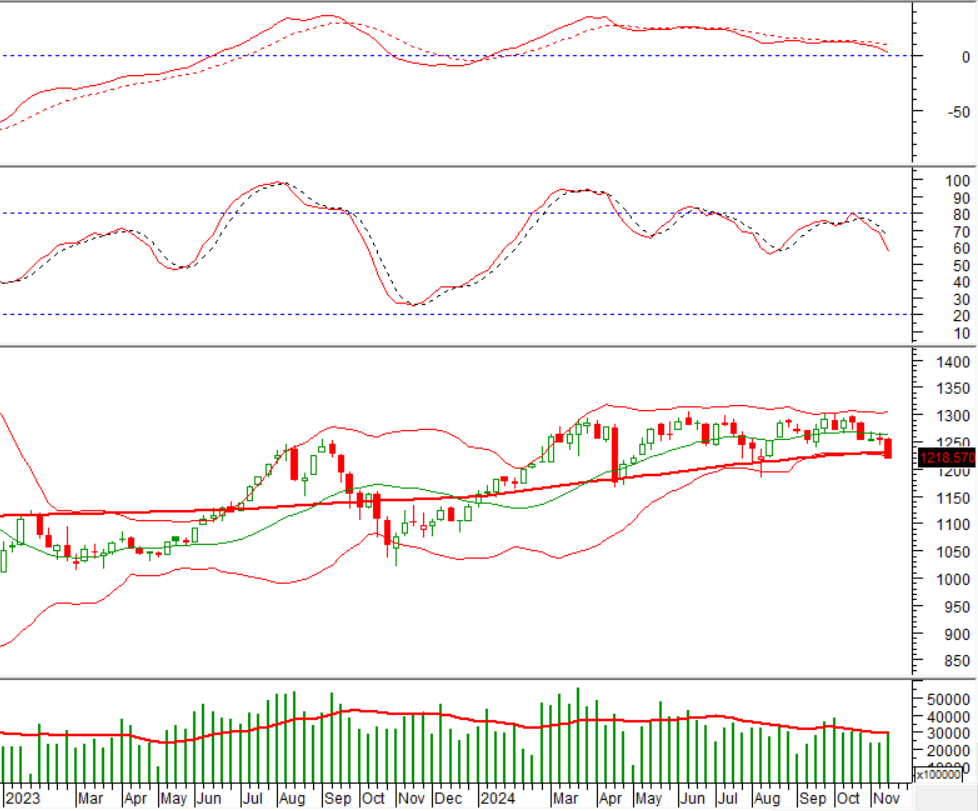
During the week of November 11-15, 2024, the VN-Index witnessed a significant decline, losing over 33 points, and forming a Black Marubozu candlestick pattern. Additionally, the index dropped below the SMA 200-week line, indicating a rather negative investor sentiment.
At the moment, the MACD and Stochastic Oscillator indicators continue their downward trajectory after issuing sell signals, reflecting that the short-term outlook remains pessimistic.
TECHNICAL ANALYSIS
Trend and Price Oscillation Analysis
VN-Index – Fibonacci Projection 23.6% Level Broken
On November 15, 2024, the VN-Index experienced a sharp drop and is currently hugging the lower band of the Bollinger Bands, suggesting a less-than-optimistic short-term outlook.
Moreover, trading volume witnessed a substantial increase, surpassing the 20-session average, indicating a pessimistic investor sentiment.
Further, the VN-Index failed to test the Fibonacci Projection 23.6% level (corresponding to the 1,225-1,245-point region) as the MACD indicator maintained its downward trajectory after a prior sell signal, implying that the short-term corrective trend may persist in upcoming sessions.

HNX-Index – Testing Critical Support
On November 15, 2024, the HNX-Index declined for the seventh consecutive session, with trading volume surpassing the 20-session average, reflecting a pessimistic investor sentiment.
Presently, the HNX-Index is retesting the April 2024 low (approximately 220-225 points) while the MACD indicator issues a fresh sell signal. In a cautious scenario, if the sell signal is sustained and the index falls below this support region, the downside risk could heighten in subsequent sessions.
Money Flow Analysis
Fluctuations in Smart Money Flow: The Negative Volume Index for the VN-Index dipped below the EMA 20-day line. Should this status persist in the upcoming session, the risk of a sudden downturn (thrust down) will elevate.

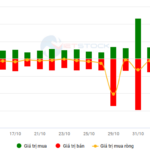
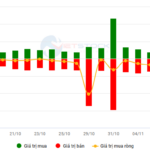
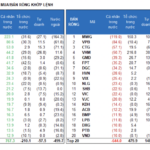
Foreign Capital Flow Variations: Foreign investors continued net selling on November 15, 2024. If this trend persists in the coming sessions, the situation could grow more pessimistic.
Vietstock Consulting and Technical Analysis Department
The Cautious Sentiment: Will It Persist?
The VN-Index retreated amid subdued trading volumes, which remained below the 20-day average. This pullback underscores investors’ cautious sentiment following the previous rally. However, the index remains firmly above the 200-day SMA, indicating that the outlook is not overly pessimistic. As of now, the Stochastic Oscillator has dipped into oversold territory, generating a buy signal. Should the MACD indicator follow suit in upcoming sessions, it would further alleviate near-term risks.
The Upcoming US Election: What’s in Store for the Vietnamese Stock Market?
The Vietnamese stock market has historically shown a positive correlation with the US stock market. With a correlation of 27% in the last month and 76% in the last quarter between the S&P 500 and the VN-Index, the movements in the US stock market are expected to significantly influence the short-term trends of the VN-Index.
The Savvy Investor’s Bottom-fishing Expedition
The VN-Index pared losses, forming a Hammer candlestick pattern with above-average volume. This indicates a temporary reprieve from market risk as bottom-fishing funds entered the market, spurring a surge in trading volume. The Stochastic Oscillator, having exited oversold territory, continues to signal a buy. If this signal holds firm in the coming sessions, the short-term outlook may not be as pessimistic.


