In addition, the VN-Index continued to closely follow the lower band of the Bollinger Bands as the MACD indicator steadily widened its gap with the signal line, reinforcing the current downward trend. The VN-Index further extended its losses after falling below the SMA 200-day moving average, indicating a gradually deteriorating long-term outlook.
I. MARKET ANALYSIS AS OF NOVEMBER 14, 2024
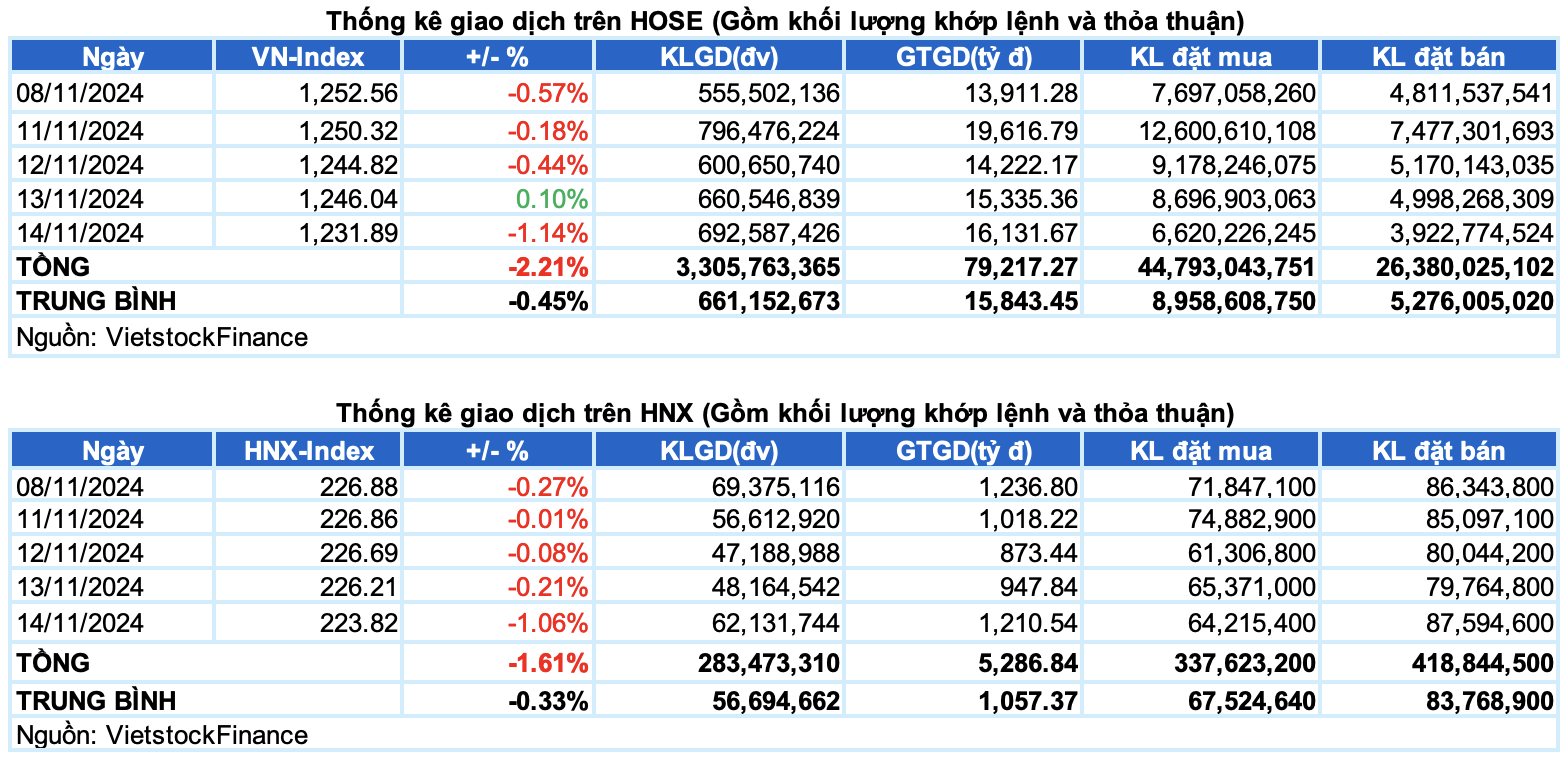
– Major indices witnessed sharp declines during the November 14 session, with the VN-Index closing 1.14% lower at 1,231.89 points, while the HNX-Index dropped 1.06% to 223.82 points.
– Trading volume on the HOSE fell 5.5% from the previous session to over 555 million units. In contrast, trading volume on the HNX rose 9.4% to over 45 million units.
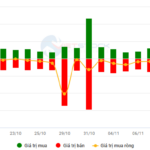
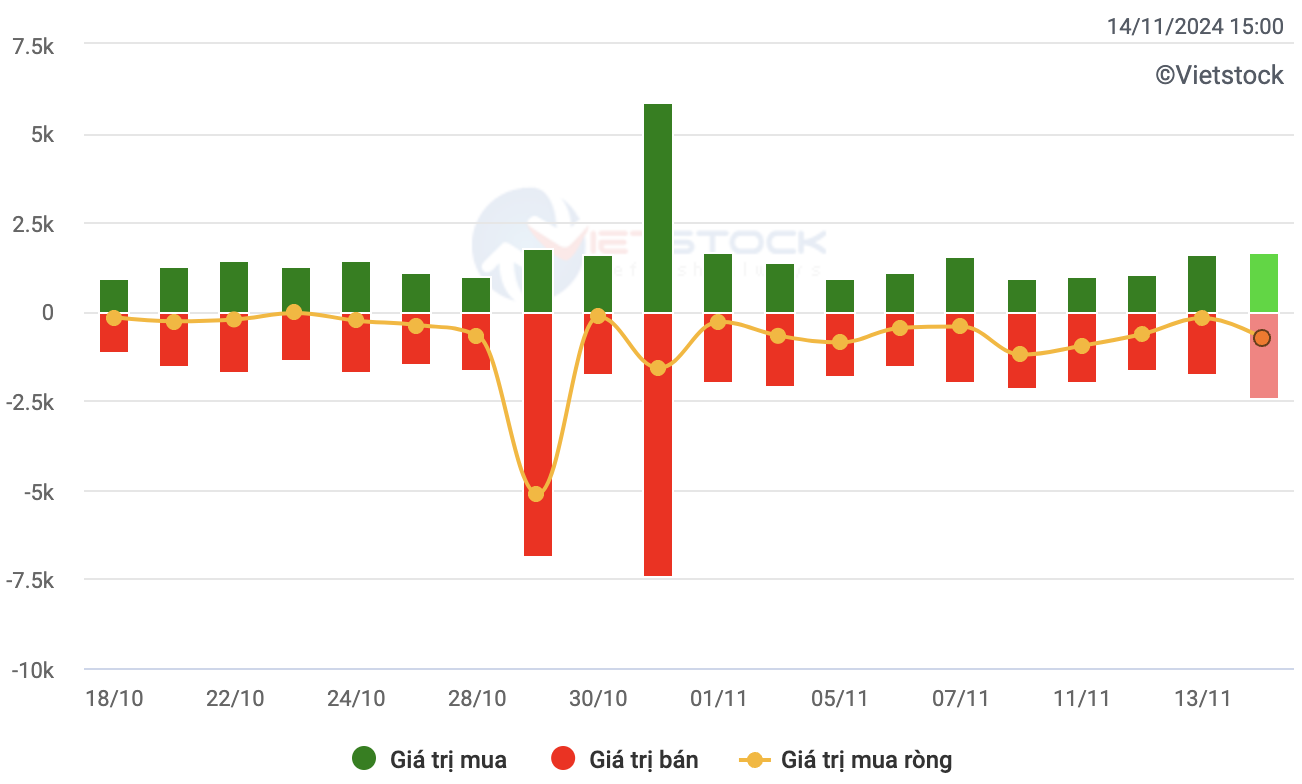
– Foreign investors continued net selling on the HOSE and HNX exchanges, with net sell values of over VND 926 billion and VND 43 billion, respectively.
Trading value of foreign investors on HOSE, HNX and UPCOM exchanges. Unit: VND billion
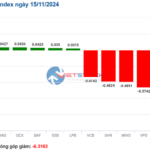
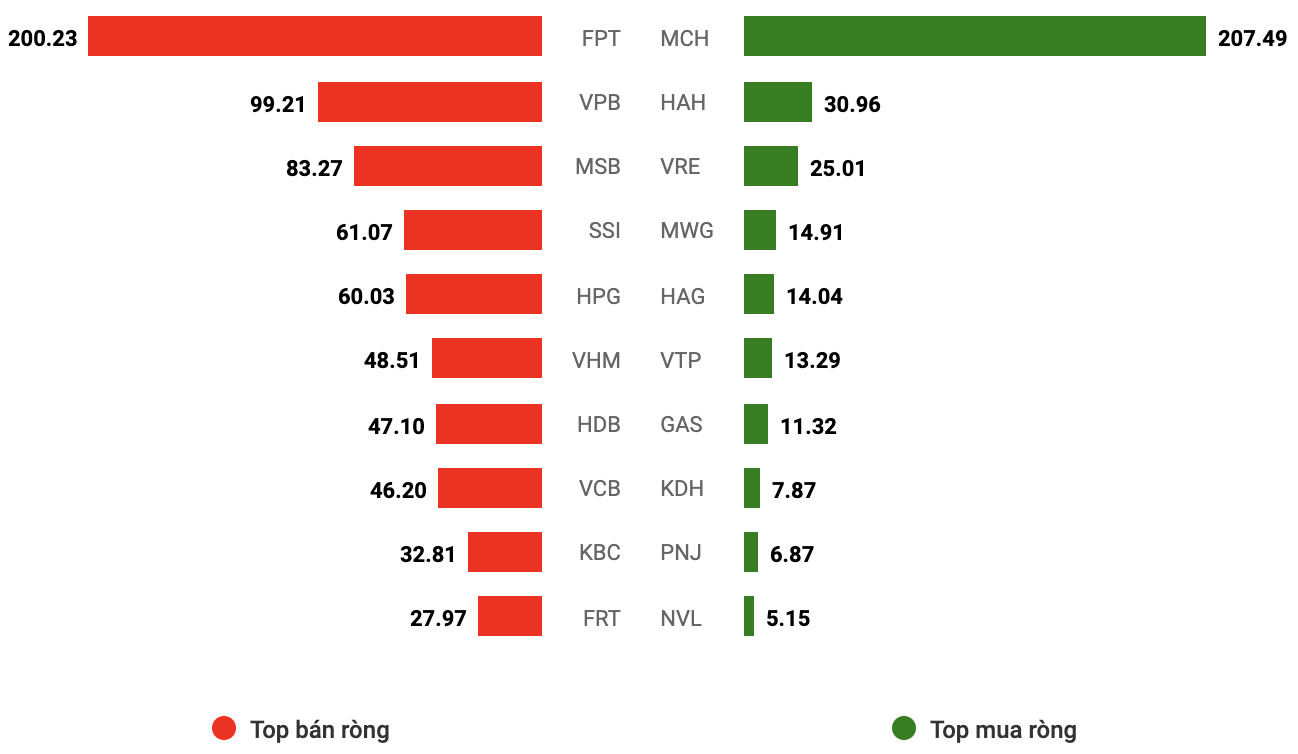
Net trading value by stock code. Unit: VND billion
– The market failed to sustain the recovery attempt from the previous session’s close, as investor sentiment remained cautious. On November 14, trading activities were subdued from the start, with the indices mostly trading sideways during the morning session. However, selling pressure gradually intensified, particularly in the banking sector, causing the indices to tumble. Red dominated the market during the afternoon session, with declining stocks far outpacing advancing ones. The VN-Index eventually closed 14.15 points lower at 1,231.89.
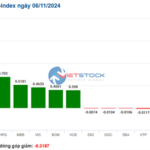
– In terms of impact, HPG, CTG, and BID were the top negative influencers, collectively dragging the VN-Index down by 3 points. Conversely, the top 10 positive influencers contributed less than 1 point to the index, highlighting the dominance of sellers.
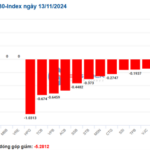
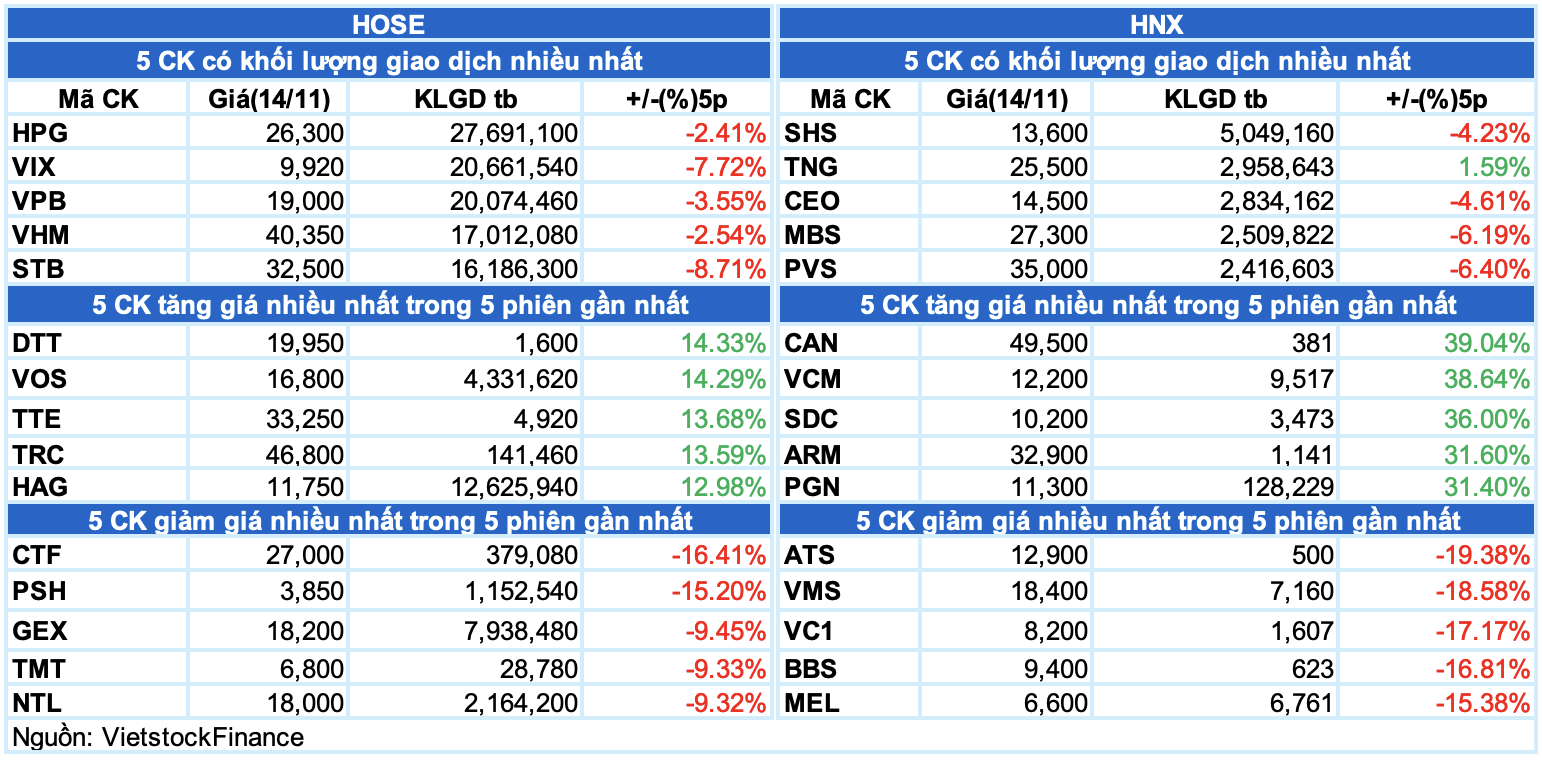
– Large-cap stocks faced substantial selling pressure, evidenced by the VN30-Index‘s 1.33% decline to 1,286.65 points. Decliners outnumbered advancers, with 23 stocks falling, 5 rising, and 2 remaining unchanged. Notably, 7 stocks posted losses of more than 2%, including SSI, HPG, STB, TPB, GVR, CTG, and MSN. Conversely, BCM stood out as a rare gainer, rising against the overall downward trend by 1%. Other advancers included SSB, VIC, VHM, and PLX, although their gains were modest, ranging from 0.1% to 0.3%.
Red dominated across all sectors, with telecommunications and energy sectors finishing at the bottom with declines of over 3%. This performance was largely influenced by significant losses in prominent stocks within these sectors, such as VGI (-5.32%), CTR (-3.84%); BSR (-3.47%), PVS (-4.11%), and PVD (-2.52%).
The materials and financial sectors also faced intense selling pressure, with numerous large-cap stocks in these sectors plunging. Notable losers included GVR (-2.33%), HPG (-2.77%), HSG (-4.26%), NKG (-4.34%), DCM (-1.06%), BMP (-1.2%); CTG (-2.18%), BID (-1.41%), VPB (-1.81%), TCB (-1.51%), STB (-2.69%), SSI (-2.95%), and VCI (-4.77%), among others.
A few individual stocks managed to buck the downward trend, standing out as bright spots. These included BCM (+1.03%), MCH (+1.23%), HAG (+3.98%), FMC (+2.42%), GMD (+1.22%), HAH (+4.12%), and NTP (+2.53%), among others.
The VN-Index‘s sharp decline, coupled with the emergence of a Black Marubozu candlestick pattern and above-average trading volume, reflected a pessimistic investor sentiment. Additionally, the index’s proximity to the lower band of the Bollinger Bands and the widening gap between the MACD and the signal line reinforced the prevailing downward trend. Moreover, the index’s continued decline after falling below the SMA 200-day moving average indicated a gradually deteriorating long-term outlook.
II. TREND AND PRICE MOVEMENT ANALYSIS
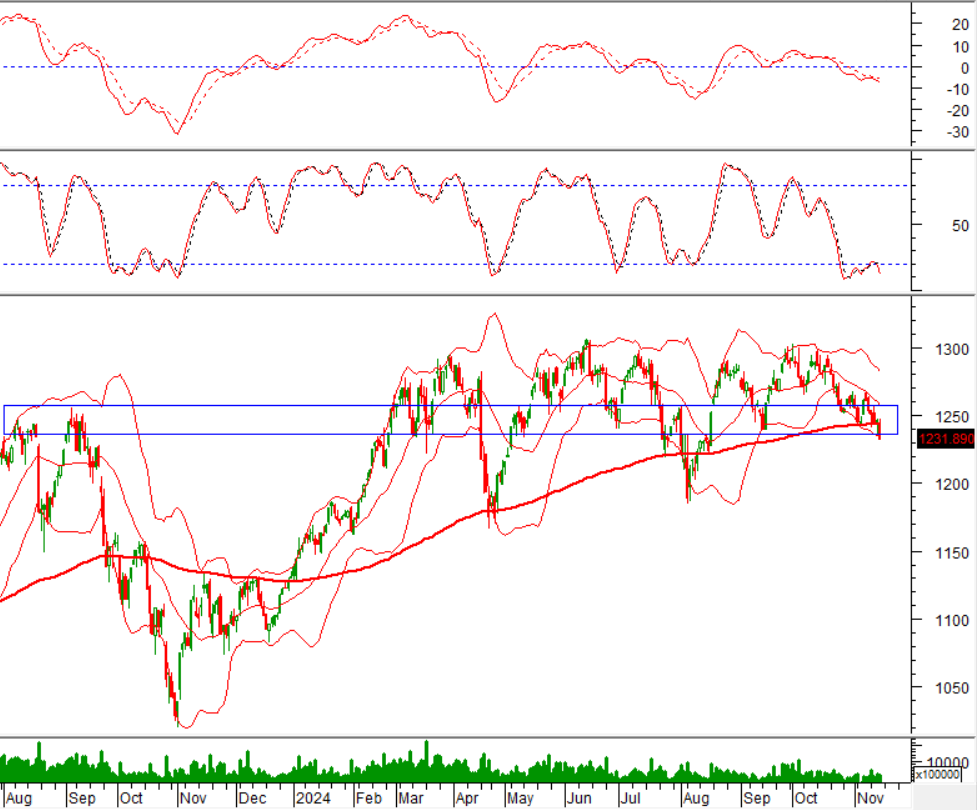
VN-Index – Indicators unanimously signal a sell-off
The VN-Index‘s steep decline, coupled with the formation of a Black Marubozu candlestick pattern and above-average trading volume, indicated a pessimistic investor sentiment.
Moreover, the index’s sustained proximity to the lower band of the Bollinger Bands and the widening gap between the MACD and the signal line reinforced the prevailing bearish trend.
The index’s continued decline after falling below the SMA 200-day moving average further underscored the gradually deteriorating long-term outlook.
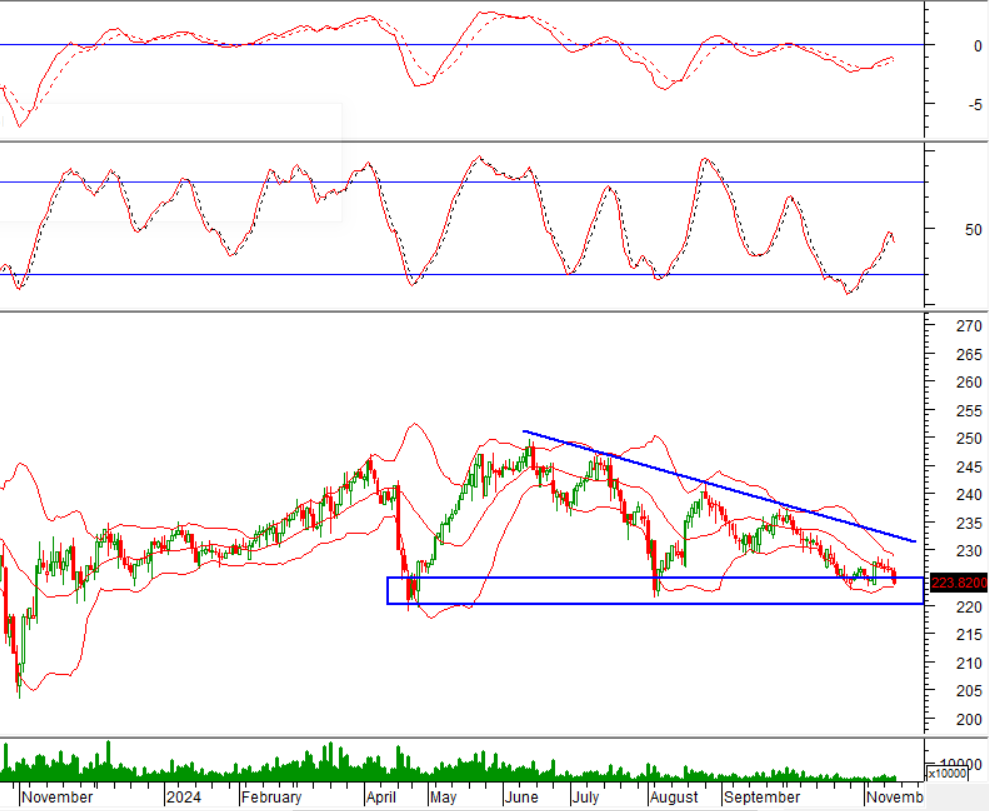
HNX-Index – Testing a critical support level
The HNX-Index declined for the sixth consecutive session, with trading volume surpassing the 20-session average, indicating a pessimistic market sentiment.
Currently, the index is testing the lower boundary of a Descending Triangle pattern (approximately 220-225 points) while the Stochastic Oscillator has issued a fresh sell signal. If this sell signal persists and the index breaks below this support zone, the downside risk will increase, with potential price targets in the 195-200 point range.
Money Flow Analysis
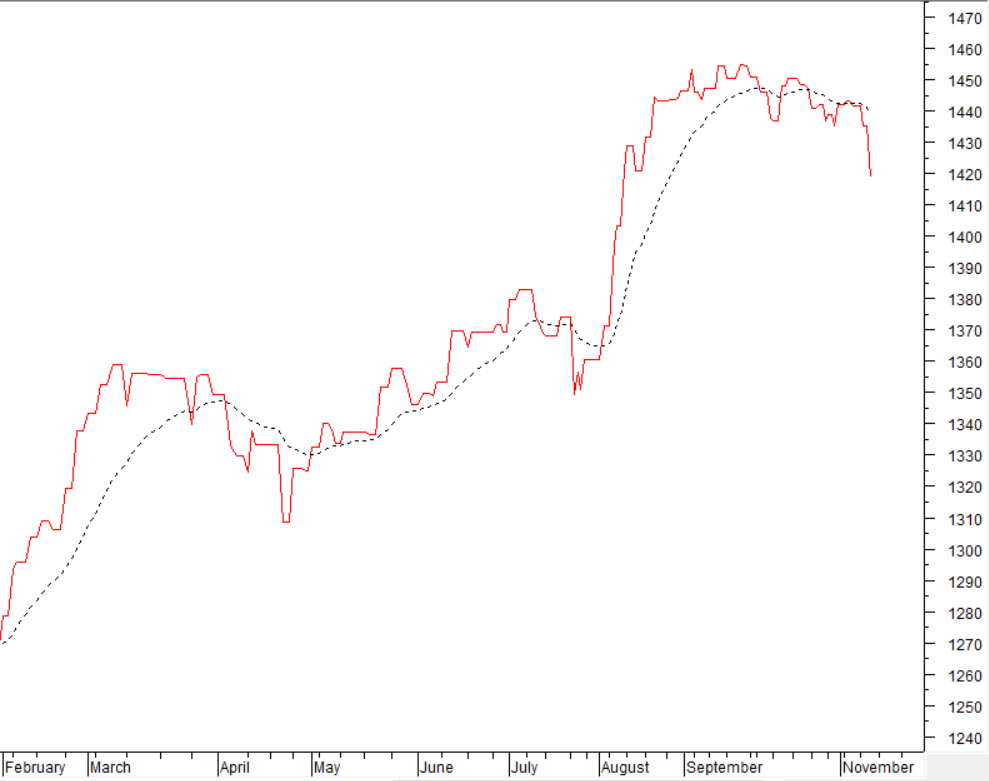
Movement of smart money: The Negative Volume Index for the VN-Index continued to weaken after falling below the EMA 20-day moving average. If this condition persists in the next session, the risk of a sudden downturn (thrust down) will increase.
Foreign capital flow: Foreign investors maintained their net selling position during the November 14, 2024, session. If this trend continues in subsequent sessions, the market sentiment may turn less optimistic.
III. MARKET STATISTICS FOR NOVEMBER 14, 2024
Economic and Market Strategy Division, Vietstock Consulting and Research
The Gloomy Sentiment Subsides
The VN-Index edged higher and rebounded after a recent streak of losses. Accompanying this rebound was a trading volume that surpassed the 20-day average, reflecting a relatively optimistic sentiment among investors. However, the Stochastic Oscillator has signaled a resumption of selling, and the MACD indicator is conveying a similar message. This suggests that the short-term outlook remains pessimistic.
The Beat of the Market: Investors Sell-Off with a Wave of Pessimism
The market closed with the VN-Index down 13.32 points (1.08%), settling at 1,218.57; the HNX-Index also ended below the reference level at 221.53 points. The market breadth tilted towards sellers, with 546 declining stocks against 193 advancing ones. The VN30-Index basket was mostly red, recording 26 losses, 3 gains, and 1 stock referencing.
The Market Beat: Green Wave Extends, VN-Index Recovers Over 15 Points
The market closed with strong gains, seeing the VN-Index surge by 1.25% to 1,261.28; a substantial increase of 15.52 points. Meanwhile, the HNX-Index also witnessed a healthy boost, rising by 1.29% to 227.76, an increase of 2.9 points. The market breadth tilted heavily in favor of bulls, with 536 tickers advancing against 147 declining names. The large-cap basket, VN30, painted a similar picture, with 29 constituents climbing and only 1 remaining unchanged.
The Market Beat: Foreigners Continue Their Selling Spree
At the end of the trading session, the VN-Index climbed 1.22 points (0.1%) to reach 1,246.04, while the HNX-Index dipped 0.48 points (0.21%), settling at 226.21. The market breadth tilted towards decliners, with 358 stocks falling versus 311 gainers. The VN30 basket, however, painted a greener picture, as 15 constituents rose, 11 fell, and 4 remained unchanged, tipping the scale in favor of the bulls.
The Ultimate Headline:
“Vietstock Weekly: Navigating the Short-Term Risks”
The VN-Index witnessed a significant drop, plunging by over 33 points, accompanied by the emergence of a bearish Black Marubozu candlestick pattern. Adding to the gloom, the index sliced below the SMA 200-week support, indicating a decidedly negative investor sentiment. Furthermore, the MACD and Stochastic Oscillator indicators continue their southward journey, reinforcing the sell signal and painting a picture of a short-term outlook that remains devoid of optimism.

