Could Bitcoin Surpass the $100,000 Mark?
According to Elliott Wave Theory, on the weekly chart, after experiencing a mid-term corrective phase, BTC officially entered the fifth wave of the impulse sequence in November 2024, confirming the continuation of the medium and long-term uptrend.
Currently, BTC is hugging the upper band of the Bollinger Bands, while the MACD indicator continues to widen the gap with the signal line, further reinforcing the strength of the current uptrend for this cryptocurrency.
Additionally, BTC has formed a Rounding Bottom pattern, indicating long-term optimism, with a potential price target of $120,000-$125,000 for this formation.
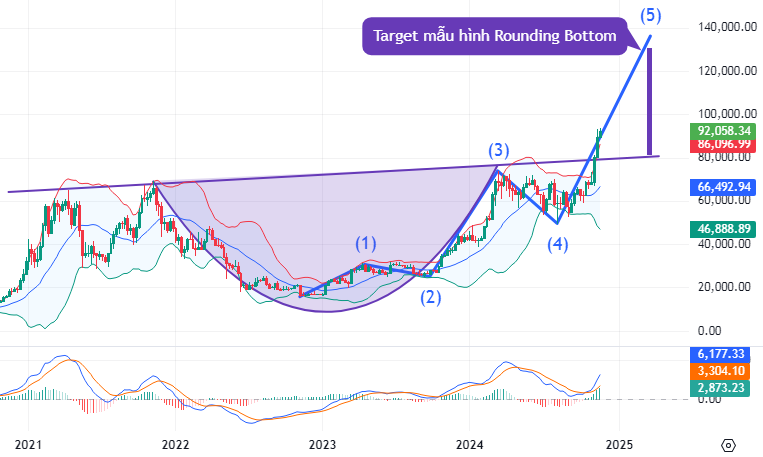
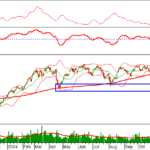
BTC Chart for 2021 – 2024. Source: TradingView
Turning to the daily chart, BTC presents a golden cross between the SMA 50 and SMA 200, while the ADX indicator continues its upward trajectory after breaking out of the gray zone (20<>).
Moreover, BTC has broken above the bearish price channel and surpassed the 100% Fibonacci retracement level (approximately $66,500-$71,500). In a bullish scenario, if the upward momentum persists, the next potential price target for BTC is the $100,000-$105,000 zone, corresponding to the 161.8% Fibonacci retracement level.
Based on these signals, investors may consider taking advantage of short-term fluctuations to initiate long positions for the aforementioned long-term targets.
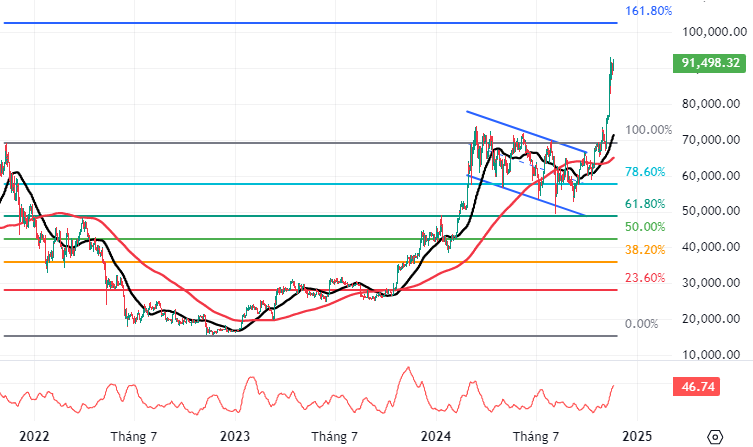
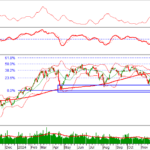
BTC Chart for 2022 – 2024. Source: TradingView
Technical Analysis Team, Vietstock Consulting
The Crypto Surge: Why Bitcoin’s Value Skyrocketed Post-Trump Election
Bitcoin Surges Towards $100,000: Why Trump’s Presidency Caused a Shock Spike.
A perfect storm of factors, including Trump’s unexpected victory, has sent Bitcoin surging towards the $100,000 mark, shocking investors and experts alike. But why has Trump’s presidency caused such a dramatic rise in this cryptocurrency’s value? In this introduction, we unravel the intriguing connection between Trump’s win and Bitcoin’s unprecedented surge.
Technical Analysis for the Session on November 22: A Tale of Diverging Fortunes
The VN-Index and HNX-Index rose in tandem, with the emergence of a Doji candlestick pattern indicating investor indecision in the market. This cautious sentiment is reflected in the hesitancy of buyers and sellers, resulting in a stalemate that led to the formation of the Doji. As the markets hover at these levels, investors are carefully weighing their options, considering the potential risks and rewards of their next move.
Technical Analysis for the Afternoon Session on November 21st: Market Sentiment Clouded by Indecision
The VN-Index and HNX-Index both climbed, forming a Doji candlestick pattern, indicating investor indecision. This pattern suggests a potential shift in market sentiment, as investors appear uncertain about the future direction of the market. With the indices hovering at these levels, it’s a pivotal moment for Vietnam’s stock market, leaving investors wondering if this is a mere pause or a sign of things to come.


