Technical Signals of VN-Index
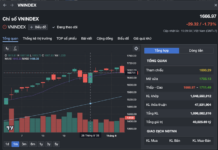
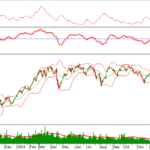
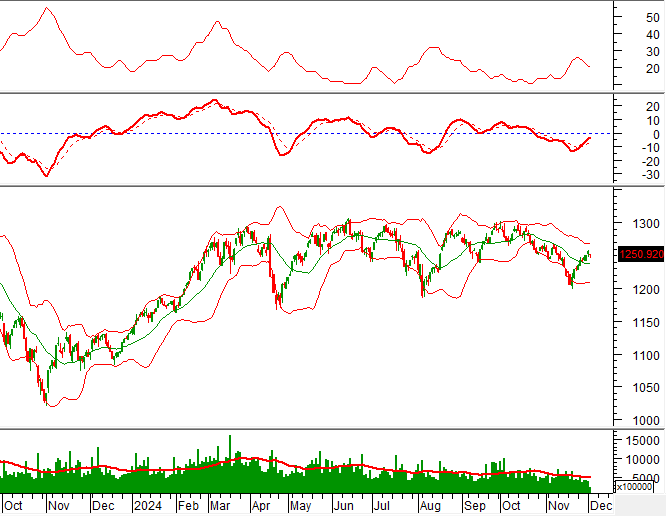
In the trading session on the morning of December 3, 2024, the VN-Index declined, and a Doji candlestick pattern emerged, with a slight increase in trading volume. This indicates that investors are hesitant and cautious in their transactions.
Currently, the index remains above the Middle line of the Bollinger Bands, while the MACD and Stochastic Oscillator indicators continue to trend upward, providing buy signals. This suggests a relatively optimistic short-term outlook.
Technical Signals of HNX-Index
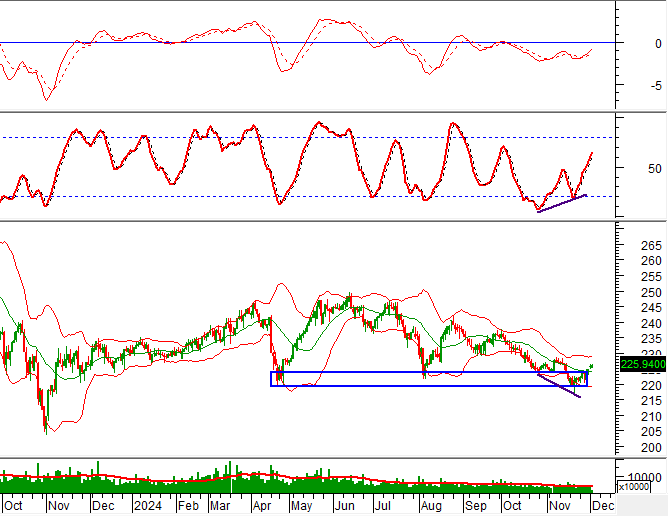
On December 3, 2024, the HNX-Index increased and retested the Middle line of the Bollinger Bands. The trading volume has been erratic, indicating unstable investor sentiment in recent sessions.
At present, the Stochastic Oscillator indicator continues to trend upward, forming a bullish divergence and providing a buy signal. The index is retesting the old low of April 2024 (corresponding to the 220-225-point region). If there is an improvement in money flow in the upcoming sessions, the prospects will be more optimistic.
CSV – Southern Basic Chemicals JSC
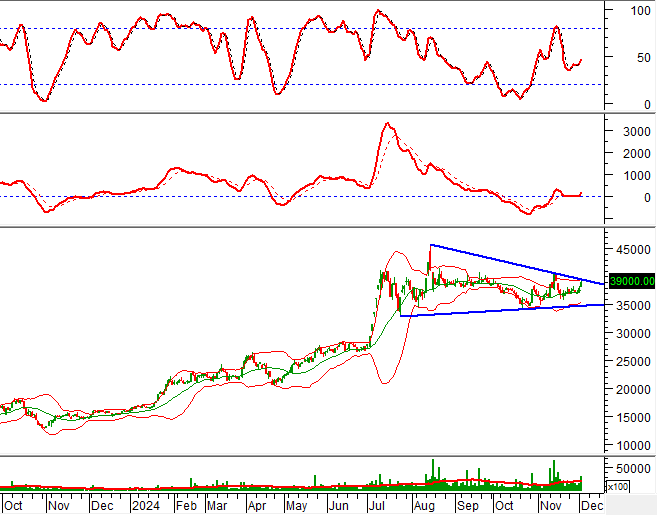
On the morning of December 3, 2024, CSV witnessed an increase in its stock price, accompanied by a trading volume that surpassed the 20-session average. This reflects the optimistic sentiment among investors.
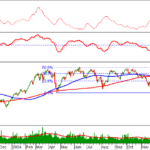
Presently, the stock price has rebounded after successfully testing the Middle line of the Bollinger Bands, and the MACD indicator has issued a buy signal again, further reinforcing the short-term upward trend of the stock.
Additionally, the stock price is retesting the upper edge of the Triangle pattern. In a positive scenario, if the stock price breaks out above this upper edge, the potential price target for the pattern is expected to be in the range of 50,000-53,000.
VCB – Vietnam Joint Stock Commercial Bank for Industry and Trade
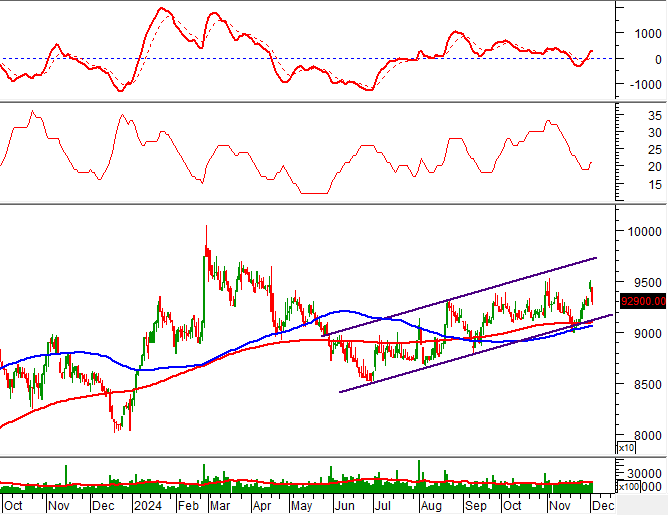
During the morning session of December 3, 2024, VCB experienced a decline in its stock price, accompanied by a significant increase in trading volume, which is expected to surpass the 20-day average by the end of the session. This indicates a pessimistic sentiment among investors.
At present, the stock price has failed to test the upper edge of the rising price channel (Bullish Price Channel), while the ADX indicator is moving within the gray area (20
Technical Analysis Department, Vietstock Consulting
Technical Analysis for the Afternoon Session of December 5th: Investors Remain Hesitant.
The VN-Index and HNX-Index both climbed, but with no significant improvement in liquidity, indicating investors’ cautious sentiment.
Market Beat: Dec 02 – Continuing Divergence, VN-Index Re-tests 1,251 Point Threshold
The market ended the session on a positive note, with the VN-Index climbing 0.75 points (0.06%) to reach 1,251.21; the HNX-Index also rose, gaining 0.68 points (0.3%) to close at 225.32. The market breadth tilted towards decliners, with 373 tickers in the red and 319 in the green. The large-cap stocks witnessed a similar trend, as 17 VN30 constituents fell, 9 advanced, and 4 closed flat, resulting in a sea of red.
Market Beat: VN-Index Retreats to 1,240-point Mark
The market closed with the VN-Index down 9.42 points (-0.75%) to 1,240.41 and the HNX-Index down 0.67 points (-0.3%) to 224.62. The market breadth tilted towards decliners with 438 losers and 260 gainers. Meanwhile, the large-cap basket VN30-Index showed a dominance of red ticks as 25 stocks fell and only 5 advanced.
The Ultimate Headline: “Selling Pressure Intensifies”
The VN-Index witnessed a significant decline, with trading volume surpassing the 20-day average, indicating a rather negative investor sentiment. The key takeaway here is that if the index manages to hold above the Middle Bollinger Band in upcoming sessions, there’s reason for cautious optimism. It’s worth noting that the MACD indicator continues to flash a buy signal and is poised to cross above the zero threshold. Should this crossover occur, it would bode well for mitigating risks.


