I. MARKET ANALYSIS OF STOCKS ON DECEMBER 19, 2024
– In the trading session on December 19, the VN-Index closed down 0.89%, to 1,254.67 points; HNX-Index gained slightly by 0.05% compared to the previous session, reaching 227.54 points.
– The matching volume on HOSE reached nearly 663 million units, up 69.1% compared to the previous session. The matching volume on HNX increased by 50.5%, reaching nearly 59 million units.
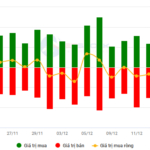
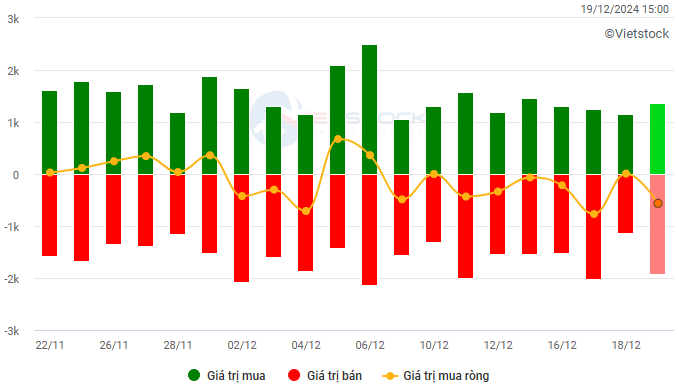
– Foreign investors net sold on the HOSE with a value of nearly VND 562 billion and net bought slightly over VND 3 billion on the HNX.
Trading value of foreign investors on HOSE, HNX, and UPCOM by day. Unit: VND billion
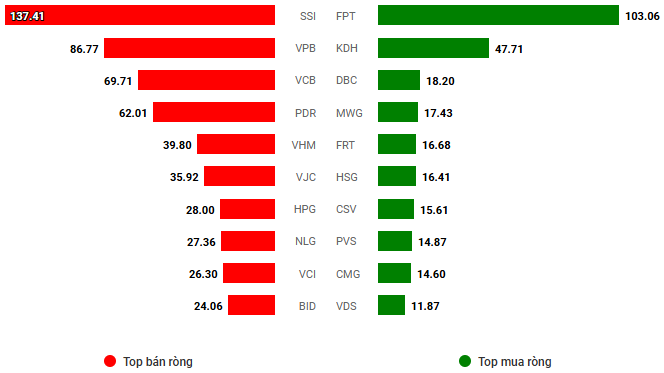
Net trading value by stock ticker. Unit: VND billion
– The global stock market wobbled after signals from the Federal Reserve (Fed) about the orientation of interest rate policies in 2025, and Vietnamese stocks were no exception. From the beginning of the session, the main indices fell sharply, but the downward pressure was not pushed too much further during the remaining trading time. The selling pressure suddenly increased sharply right before the ATC session, but the VN-Index also recovered in time after testing the 1,250-point milestone. At the end of the session, the VN-Index fell 11.33 points, closing at 1,254.67 points.
– In terms of impact, VCB, HPG, and TCB were the pillars that put the most pressure, taking away 2.5 points from the general index. Meanwhile, there were no notable names on the opposite side, and the 10 most positive stocks only helped the VN-Index rise by half a point.
– The VN30-Index closed down 1.18%, to 1,314.16 points. Sellers dominated with 26 decreasing stocks, 2 increasing stocks, and 2 unchanged stocks. Among them, SSB was the worst performer, plunging 4.3%. This was followed by TCB, BCM, HPG, and VHM, which decreased by almost 2%. In contrast, BVH and PLX were the only two stocks that managed to stay in the green, but the increase was quite modest at less than 0.5%.
Although the stock pillars caused the general index to fall sharply, half of the sector groups still maintained a green color. Notably, the telecommunications group shone with the purple color right from the start of the session for YEG stock. In addition, VGI (+3.98%), ELC (+1.28%), TTN (+9.14%), and CAB (+1.43%) also performed well. Many energy stocks also went against the general trend, typically PVS (+1.76%), PVD (+0.21%), POS (+5.47%), PVB (+2.98%), and PVC (+0.91%).
On the other hand, sectors with large capitalization weights such as finance, real estate, and materials all decreased by more than 1%, putting pressure on the market indices. Notable losers included SSB (-4.35%), TCB (-1.86%), MBB (-1.45%), ACB (-1.39%), HDB (-1.26%), and MSB (-1.74%); VHM (-1.71%), BCM (-1.92%), KBC (-1.95%), NLG (-2.41%), and PDR (-2.55%); HPG (-1.83%), GVR (-1.44%), and VGC (-1.44%), among others.
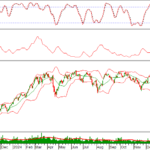
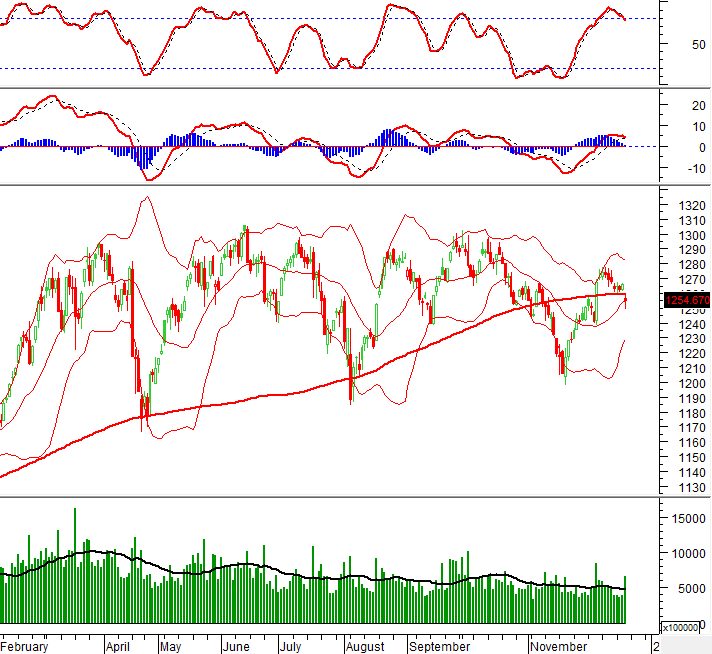
The VN-Index fell sharply with the appearance of a Falling Window candlestick pattern and dropped below the Middle line of the Bollinger Bands. In addition, the trading volume exceeded the 20-day average, indicating investors’ negative sentiment. Currently, the Stochastic Oscillator indicator continues to give a sell signal and exits the overbought zone. If, in the coming time, the MACD indicator also gives a similar signal, the risk of a downward adjustment will increase.
II. TREND AND PRICE MOVEMENT ANALYSIS
VN-Index – Fell below the Middle line of the Bollinger Bands
The VN-Index fell sharply with the appearance of a Falling Window candlestick pattern and dropped below the Middle line of the Bollinger Bands. Additionally, the trading volume exceeded the 20-day average, indicating investors’ negative sentiment.
At present, the Stochastic Oscillator indicator continues to give a sell signal and has exited the overbought zone. If, in the near future, the MACD indicator also gives a similar signal, the risk of a downward correction will increase.
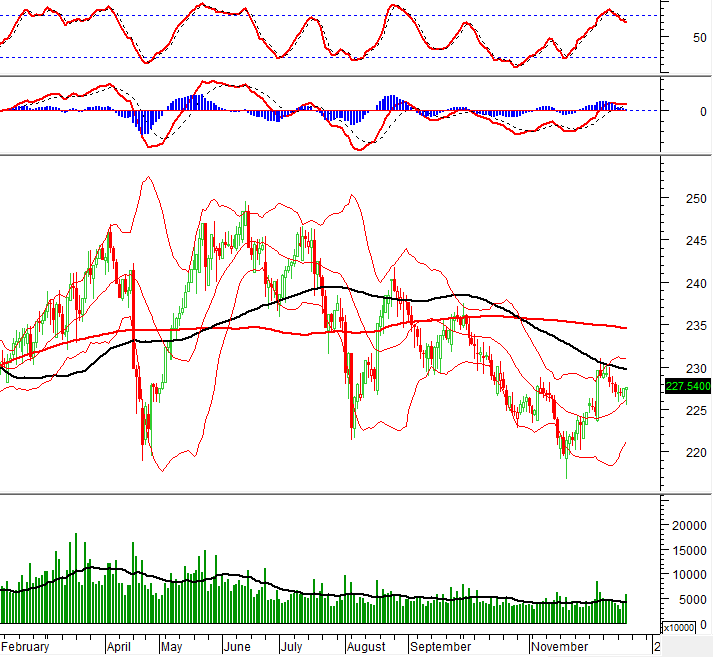
HNX-Index – The Stochastic Oscillator indicator continued to decline after giving a sell signal
The HNX-Index increased and formed a Hammer candlestick pattern, indicating the optimism of investors. Moreover, the trading volume surpassed the 20-day average, signifying that money was flowing back into the market.
However, the Stochastic Oscillator indicator continued to decline after giving a sell signal and has exited the overbought zone. Investors should be cautious if the MACD indicator gives a similar signal in the future.
Analysis of Money Flow
Fluctuations in Smart Money Flow: The Negative Volume Index indicator of the VN-Index cut down below the 20-day EMA. If this state continues in the next session, the risk of a sudden drop (thrust down) will increase.
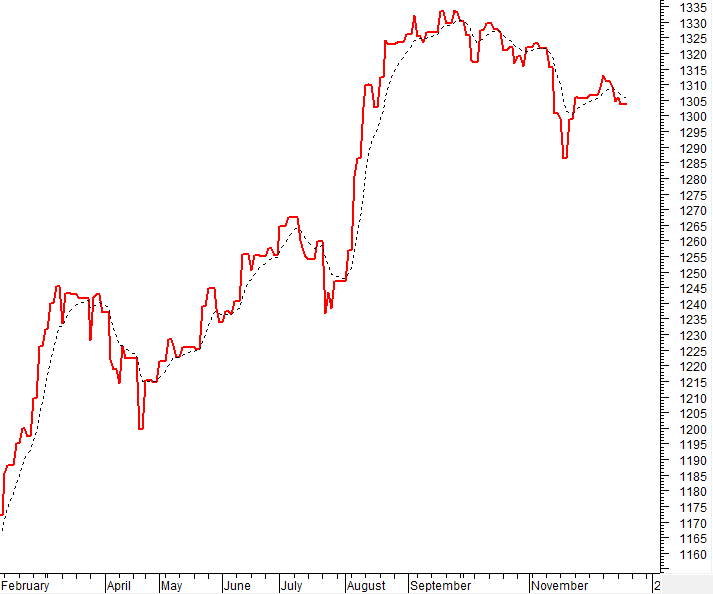
Fluctuations in Foreign Capital Flow: Foreign investors continued to net sell in the trading session on December 19, 2024. If foreign investors maintain this action in the coming sessions, the situation will become more pessimistic.
III. MARKET STATISTICS ON DECEMBER 19, 2024
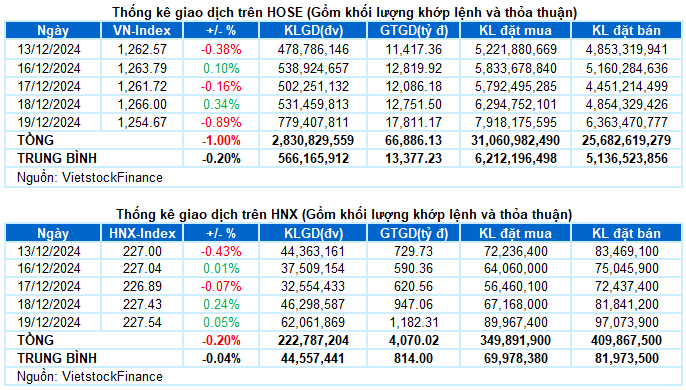
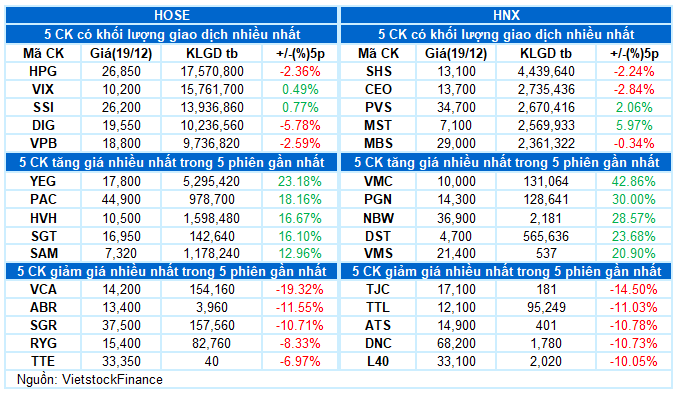
Economic Analysis & Market Strategy Division, Vietstock Consulting Department
Trump 2.0: Opportunity or Challenge for Stock Investors?
The upcoming livestream, “Trump’s Election Win: Opportunity or Challenge for Stock Investors?” airing at 3:00 PM on December 19, 2024, on the official Fanpage and YouTube channel of DNSE Joint Stock Securities Company, promises to deliver sharp insights and a multifaceted perspective on the 2025 stock market outlook.
The Art of Liquidity: Unveiling the Path to Recovery
The VN-Index returned to positive territory, maintaining its position above the 200-day SMA. To reinforce this upward trend, trading volume needs to surpass the 20-day average. The Stochastic Oscillator has already signaled a sell-off in the overbought region, while the MACD indicator hints at a narrowing gap with the Signal Line.
Technical Analysis for the Session on December 19th: Unexpectedly Gloomy Sentiment
The VN-Index and HNX-Index both witnessed declines, alongside a significant surge in trading volume during the morning session, indicating a prevailing sense of pessimism among investors.


