I. MARKET ANALYSIS OF STOCKS ON 01/02/2025
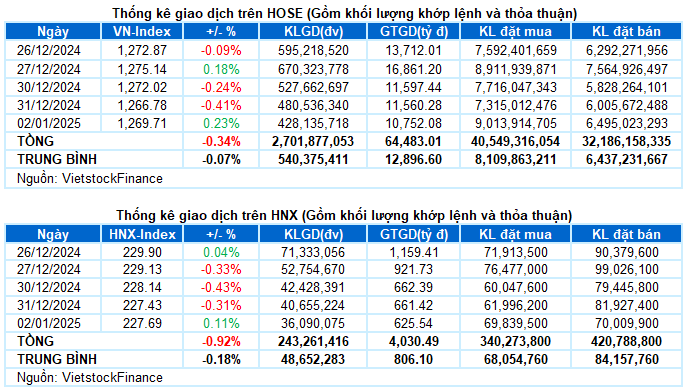
– The main indices wore light blue in the first trading session of the year. VN-Index ended the session up 0.23%, reaching 1,269.71 points; HNX-Index increased by 0.11% compared to the previous session, reaching 227.69 points.
– The matching volume on HOSE reached nearly 372 million units, a further decrease of 8.7% compared to the low of the previous session. The matching volume on HNX also decreased by 14.7%, reaching more than 31 million units.
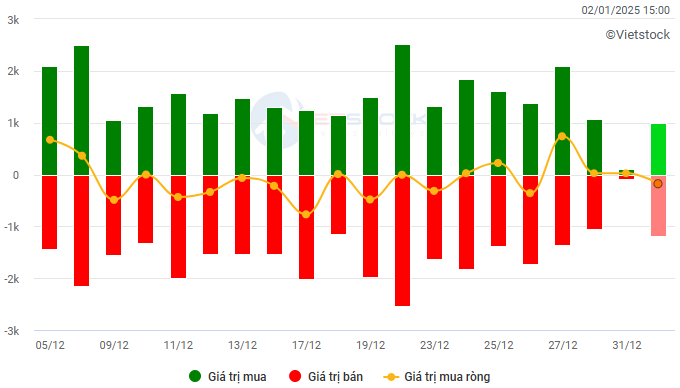
– Foreigners net sold on the HOSE floor with a value of more than VND 156 billion and net sold nearly VND 9 billion on the HNX floor.
Trading value of foreign investors on HOSE, HNX and UPCOM by day. Unit: VND billion
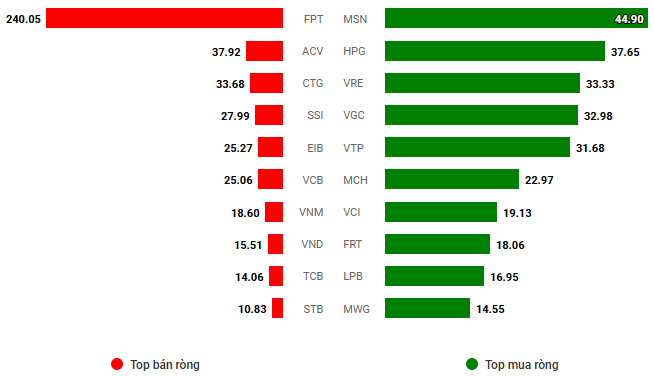
Net trading value by stock code. Unit: VND billion
– The first securities trading session of 2025 took place in a tug-of-war. VN-Index started with a light blue but quickly lost points as some large-cap stocks weakened, along with market liquidity continuing to be low. However, improved demand in the afternoon session helped the index recover and return to green. At the close, the VN-Index increased by 2.93 points (+0.23%) to 1,269.71 points.
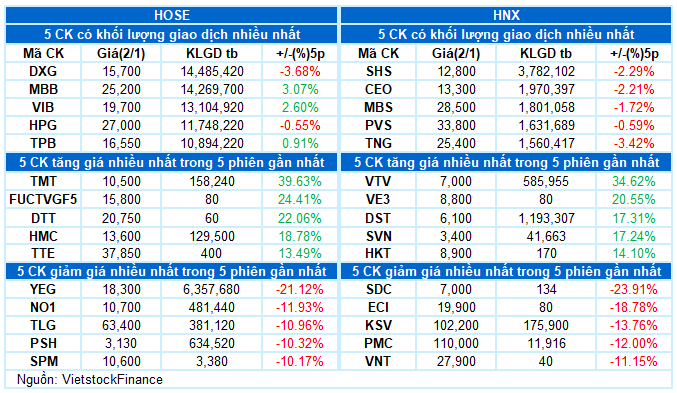
– In terms of impact, BID and VCB contributed the most positively to the VN-Index with more than 2 points increase. Meanwhile, TCB and HDB were under significant selling pressure, taking away nearly 1 point from the overall index.
– VN30-Index ended the session down 0.12%, to 1,343.2 points. The basket width was quite divided, recording 11 codes decreased, 12 codes increased, and 7 codes stood at the reference price. On the rise, the codes that increased by more than 1% included BID, PLX, BVH, HPG, and MSN. In contrast, HDB and TCB were at the bottom with a decrease of 1.6% and 1.2%, respectively.
Blue still dominated in the industry groups. Among them, the industry group led the market in the first year, with a focus on transport and construction stocks such as ACV (+1.52%), HVN (+1.92%), VTP (+5.19%), GMD (+1.53%), PHP (+2.14%), CTD (+1.31%), HBC (+4.84%), C4G (+1.28%), and DPG (+3.26%).
The large-cap industry groups such as finance and real estate were mixed. Most stocks rose and fell slightly around the reference price, except for some codes with significant fluctuations such as BID (+1.73%), TCB (-1.22%), HDB (-1.57%), OCB (-3.07%), EIB (-2.85%), BVH (+1.58%), VCI (+1.2%), KDH (-2.63%), SIP (-1.32%), HDG (+1.93%), and NVL (+1.46%).
On the negative side, the essential consumer group had to finish last due to the significant influence of the stock with an overwhelming market cap in the industry, MCH (-3.82%). In addition, stocks also faced significant selling pressure, SBT (-1.91%), MPC (-1.34%), MML (-1.63%), and VNM (-0.47%). However, a few names still shone, such as HNG hitting the ceiling, HAG (+2.07%), MSN (+1.14%), QNS (+1.37%), and DBC (+1.98%).
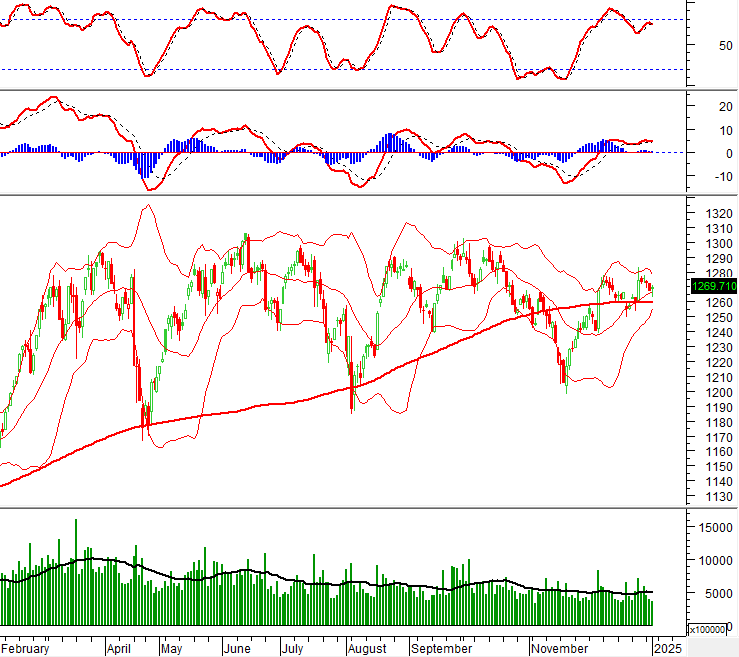
VN-Index rebounded after testing the Middle line of the Bollinger Bands while trading volume continued to be below the 20-day average. This indicates that the money flow participating in the market is still very limited. Currently, the Stochastic Oscillator indicator shows a sell signal again. If, in the next sessions, the MACD indicator also gives a similar signal, the risk of adjustment will increase.
II. TREND AND PRICE MOVEMENT ANALYSIS
VN-Index – Above the Middle Line of Bollinger Bands
VN-Index rebounded after testing the Middle line of the Bollinger Bands while trading volume continued to be below the 20-day average. This indicates that the money flow participating in the market is still very limited.
Currently, the Stochastic Oscillator indicator shows a sell signal again. If, in the next sessions, the MACD indicator also gives a similar signal, the risk of adjustment will increase.
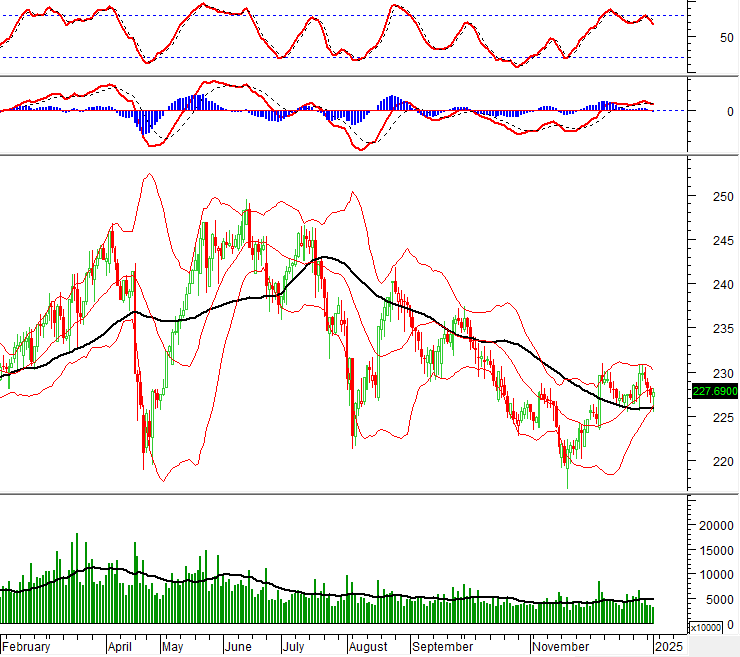
HNX-Index – Stochastic Oscillator and MACD indicators show sell signals
HNX-Index slowed its decline with a slight increase after testing the SMA 50-day line. However, trading volume remained below the 20-day average, indicating that buying demand was still not positive.
Currently, the Stochastic Oscillator and MACD indicators have shown sell signals. This suggests that the outlook for the coming period remains uncertain.
Money Flow Analysis
Fluctuation of smart money flow: The Negative Volume Index indicator of VN-Index cut down below the EMA 20-day line. If this state continues in the next session, the risk of a sudden drop (thrust down) will increase.

Fluctuation of foreign capital flow: Foreigners continued to net sell in the trading session on 01/02/2025. If foreign investors maintain this action in the coming sessions, the situation will be less optimistic.
III. MARKET STATISTICS ON 01/02/2025
Economic Analysis and Market Strategy Department, Vietstock Consulting
– 16:56 01/02/2025


