I. MARKET ANALYSIS OF STOCK MARKET BASICS AS OF 12/31/2024
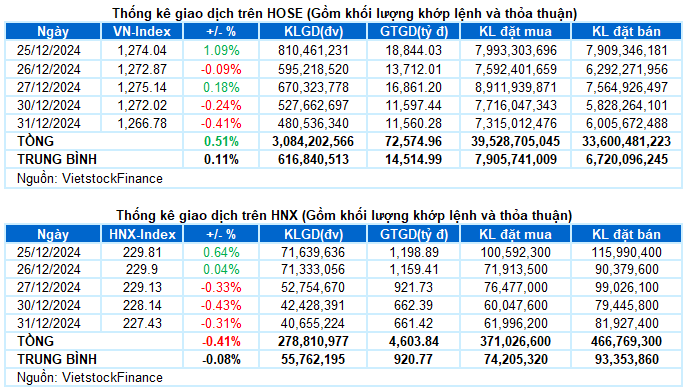
– The main indices lost points on the last trading day of 2024. VN-Index closed down 0.41%, at 1,266.78 points; HNX-Index decreased by 0.31% compared to the previous session, falling to 227.43 points.
– The matching volume on HOSE reached just over 407 million units, down 10.1% from the previous session. The matching volume on HNX increased by 3.7%, reaching more than 36 million units.
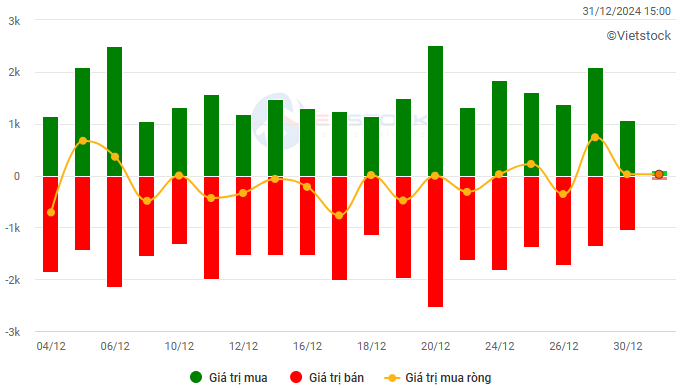
– Foreigners net sold slightly on the HOSE with a value of more than 257 million VND and net sold more than 4.5 billion VND on the HNX.
Trading value of foreign investors on HOSE, HNX and UPCOM by day. Unit: Billion VND
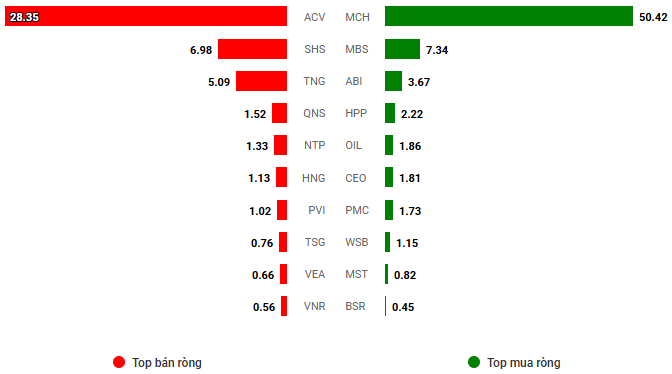
Net trading value by stock code. Unit: Billion VND
– The last trading session of 2024 took place in a quiet atmosphere as liquidity dried up, reflecting a clear holiday sentiment among investors. The market mainly fluctuated and fluctuated below the reference level throughout the trading session, but strong selling pressure suddenly appeared in the ATC session, especially in the group of pillar stocks, causing VN-Index to lose more than 5 points. Closing the year 2024, VN-Index stopped at the level of 1,266.78 points, recording an increase of 12.11% compared to the beginning of the year.
– In terms of impact, CTG, VCB, BID, and HDB were the main pillars that pulled the market down the most in the last session, taking away nearly 4.5 points from the VN-Index. On the other hand, FPT, ACB, and TCB pulled back 1.5 points for the general index.
– VN30-Index ended the session down 0.19%, reaching 1,344.75 points. The sellers still dominated with 18 codes decreasing, 7 increasing, and 5 references. Of which, HDB after the “flash” ceiling session yesterday has strongly adjusted again, down 4.3%. Next are CTG, STB, and BVH, which also plunged more than 2%. On the opposite side, 5/7 green codes increased by more than 1%, including ACB, BCM, FPT, MBB, and TCB.
Today’s decline was mainly due to pressure from the group of pillar stocks. The financial group “bottomed out” with a decrease of 0.76% as red covered a large area. Stocks under strong selling pressure include HDB (-4.32%), CTG (-2.83%), STB (-2.51%), BID (-1.83%), PVI (-3.94%), PSI (-2.56%), BVH (-2.5%), SSI (-1.51%), FTS (-1.4%), and MSB (-1.38%). A few bright spots in this industry are OCB (+3.64%), ACB (+1.57%), MBB (+1.21%), TCB (+1.02%), VAB (+2.17%), and ABB (+1.37%),…
Following is the group of materials also dominated by red when many stocks with large capitalization in the industry adjusted, typically KSV had the second consecutive floor session, HSG (-1.34%), NKG (-1.37%), GVR (-0.65%), DCM (-1.79%), DPM (-1.27%), BMP (-1.21%), and KSB (-2.37%).
On a positive note, the groups of essential consumer goods, information technology, and telecommunications respectively topped the table with an increase of over 1%. Main contributions came from the upward momentum of stocks such as MCH (+6.38%), ANV (+1.02%), HNG (+1.67%); FPT (+1.33%), CMT (+2.58%); VGI (+1.21%), CTR (+1.22%), and FOX (+2%).
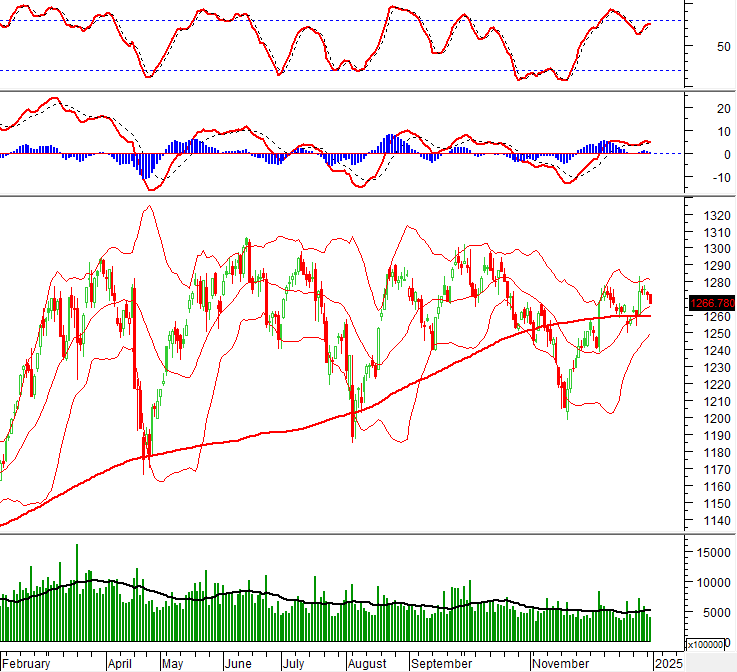
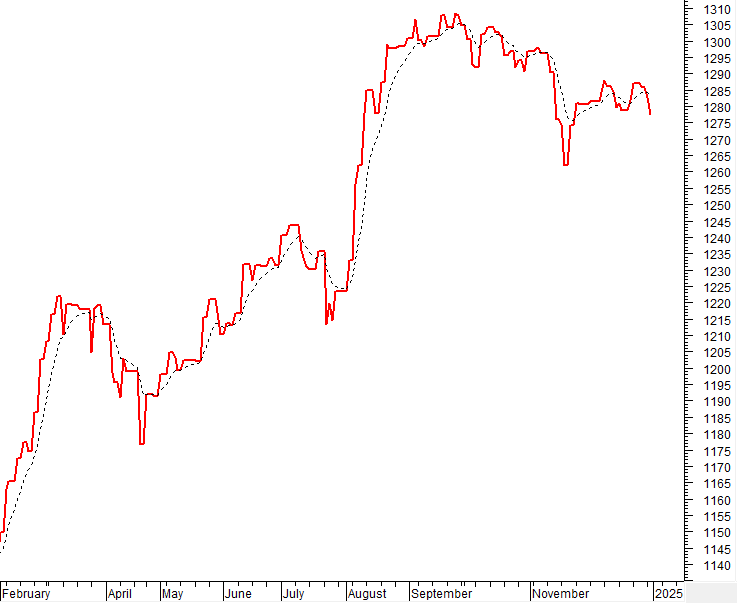
VN-Index lost points quite negatively with trading volume falling below the 20-day average. This indicates that investors’ psychology is showing signs of becoming cautious again. However, the index is above the Middle line of the Bollinger Bands. If, in the next sessions, the index holds above this threshold and the MACD indicator continues to maintain a buy signal, the situation will not be too negative.
II. ANALYSIS OF TRENDS AND PRICE FLUCTUATIONS
VN-Index – Located above the Middle line of the Bollinger Bands
VN-Index lost points quite negatively with trading volume falling below the 20-day average. This indicates that investors’ psychology is showing signs of becoming cautious again.
However, the index is above the Middle line of the Bollinger Bands. If, in the next sessions, the index holds above this threshold and the MACD indicator continues to maintain a buy signal, the situation will not be too negative.
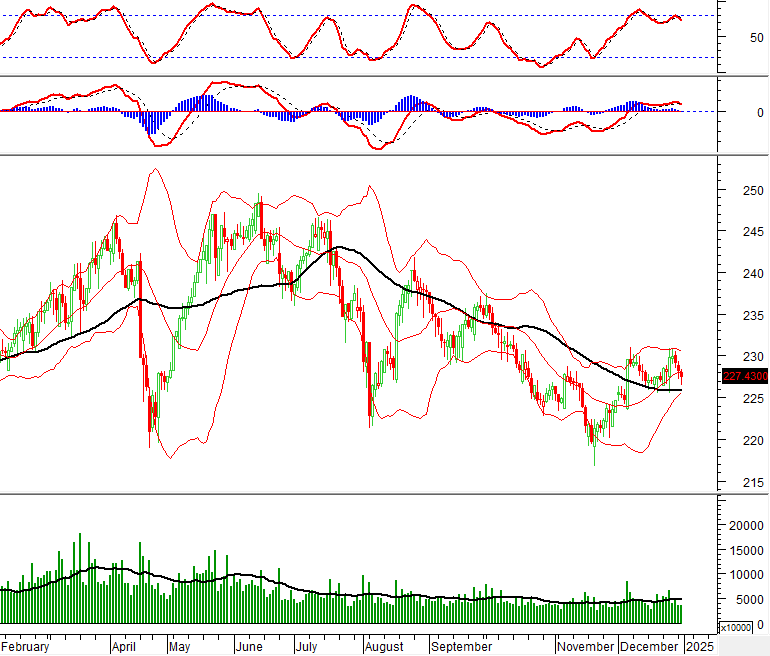
HNX-Index – The MACD indicator appears to be a sell signal
HNX-Index fell for three consecutive sessions amid trading volume maintained below the 20-day average. This indicates that investors’ caution is increasing.
Currently, the Stochastic Oscillator indicator appears to be a sell signal again, while the MACD is also giving a similar signal. This indicates that the risk of short-term adjustment is still ongoing.
Analysis of Capital Flows
Fluctuations in smart money flow: The Negative Volume Index indicator of VN-Index cuts down below the EMA 20 day line. If this state continues in the next session, the risk of an unexpected drop (thrust down) will increase.
Fluctuations in capital flow from foreign investors: Foreigners net sold again in the trading session on December 31, 2024. If foreign investors maintain this action in the coming sessions, the situation will be more pessimistic.
III. MARKET STATISTICS AS OF 12/31/2024
Department of Economic Analysis & Market Strategy, Vietstock Consulting
– 17:06 12/31/2024
Stock Market Week of 12/16/2024 – 12/20/2024: A Prevailing Mood of Caution

The VN-Index edged higher last week, with alternating sessions of gains and losses. While the index inched up, the trading volume fell below the 20-day average, indicating that investors remain cautious. Moreover, foreign investors’ continued net selling streak suggests that the short-term outlook for the market is still not optimistic.
The Market Outlook: A Cautious Tone for the Short Term?

The VN-Index rebounded after testing the middle Bollinger Band, with trading volumes remaining below the 20-day average. This indicates a continued lack of liquidity in the market. Currently, the Stochastic Oscillator indicates a sell signal, and if the MACD follows suit in upcoming sessions, the risk of a correction will increase.
The Market Beat: Transport Sector Shines Amid Dull Liquidity

The market closed with the VN-Index up 2.83 points (0.23%) at 1,257.5, while the HNX-Index fell 0.47 points (-0.21%) to 227.07. The market breadth tilted towards gainers with 452 advancing stocks against 284 declining stocks. The VN30 basket saw a slight dominance of green with 14 gainers, 12 losers, and 4 stocks unchanged.
Vietstock Weekly: Navigating Short-Term Risks

The VN-Index ended a rather pessimistic trading week as it continued to lose points and fell below the Middle Bollinger Band. The decline was accompanied by a drop in trading volume below the 20-week average, indicating limited participation of funds in the market. Currently, the MACD indicator is poised to give a sell signal as it narrows its gap with the Signal Line. Should this occur in the coming period, the index’s situation will turn even more negative.
The Cautious Sentiment Rises

The VN-Index witnessed a negative trading session with a decline in trading volume below the 20-day average. This indicates a resurgence of cautious sentiment among investors. However, it’s important to note that the index is currently sitting above the middle Bollinger Band. If the index manages to hold its ground above this level in upcoming sessions and the MACD indicator continues to flash a buy signal, the situation may not be as pessimistic as it seems.


