STOCK MARKET REVIEW FOR THE WEEK OF 12/16/2024 – 12/20/2024
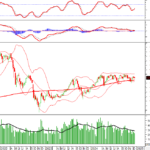
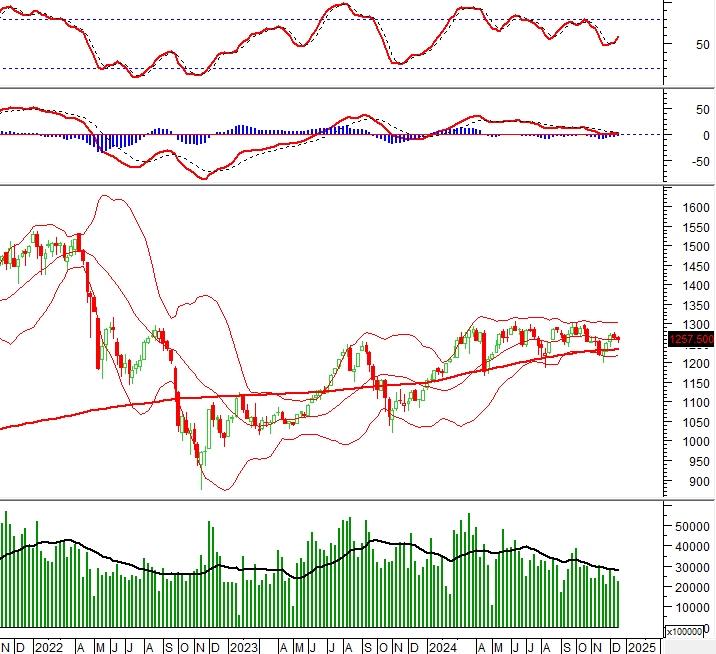
During the week of 12/16/2024 – 12/20/2024, the VN-Index closed on a less optimistic note as it continued to lose points and fell below the Middle Bollinger Band. Moreover, trading volume fell below the 20-week average, indicating limited participation in the market.
Currently, the MACD indicator is likely to give a sell signal after narrowing the gap with the Signal Line. If this happens in the coming period, the situation of the index will become even more negative.
TECHNICAL ANALYSIS
Trend and Price Oscillation Analysis
VN-Index – Spinning Top Candlestick Pattern Emerges
On 12/20/2024, the VN-Index posted a slight gain and formed a Spinning Top candlestick pattern, while trading volume fluctuated erratically in recent sessions, indicating investors’ unstable psychology.
Additionally, the Stochastic Oscillator has fallen out of the overbought region after a sell signal emerged, suggesting a heightened risk of a downward adjustment.

HNX-Index – ADX Continues to Weaken
On 12/20/2024, the HNX-Index declined and moved closer to the Middle Band while the Bollinger Bands contracted (Bollinger Squeeze), and trading volume exceeded the 20-session average, reflecting investors’ diminishing optimism.
Furthermore, the ADX indicator continued to weaken and remained below 20, indicating a very weak trend and suggesting that the sideways movement with alternating up and down sessions is likely to persist in the near term.

Money Flow Analysis
Smart Money Flow Variation: The Negative Volume Index indicator for the VN-Index dropped below the 20-day EMA. If this condition persists in the next session, the risk of a sudden downturn (thrust down) will increase.

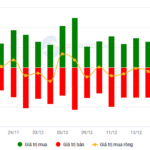
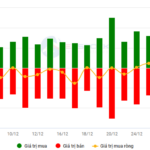
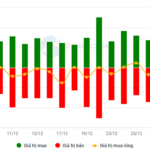
Foreign Capital Flow Variation: Foreign investors continued to sell net during the trading session on 12/20/2024. If foreign investors maintain this action in the coming sessions, the situation will become even more pessimistic.
Technical Analysis Department, Vietstock Consulting
Vietstock Weekly: Short-Term Risks Remain
The VN-Index ended a rather pessimistic trading week as it continued to lose points and slip below the Middle Bollinger Band. The decline was accompanied by a drop in trading volume below the 20-week average, indicating limited participation of funds in the market. Currently, the MACD indicator is poised to give a sell signal as it narrows its gap with the Signal Line. Should this occur in the coming period, the index’s outlook will turn increasingly negative.
Stock Market Week of 12/16/2024 – 12/20/2024: Caution Prevails
The VN-Index edged higher last week, with alternating sessions of gains and losses. While the index inched up, the trading volume fell below the 20-day average, indicating that investors remain cautious. Moreover, foreign investors’ continued net selling streak suggests that the short-term outlook for the market is still not optimistic.
The Cautious Sentiment Rises
The VN-Index witnessed a negative trading session with a decline in trading volume below the 20-day average. This indicates a resurgence of cautious sentiment among investors. However, it’s important to note that the index is currently sitting above the middle Bollinger Band. If the index manages to hold its ground above this level in upcoming sessions and the MACD indicator continues to flash a buy signal, the situation may not be as pessimistic as it seems.
The Market Beat: Transport Sector Shines Amid Dull Liquidity
The market ended the session on a positive note, with the VN-Index climbing 0.23% to 1,257.5, a gain of 2.83 points. In contrast, the HNX-Index dipped 0.21%, or 0.47 points, settling at 227.07. The market breadth tilted in favor of the bulls, with 452 tickers advancing against 284 declining stocks. The VN30 basket also witnessed a similar trend, as 14 stocks added value, 12 stocks retreated, and 4 remained unchanged, ending with a slightly bullish tilt.
The Ultimate Headline: “Is Short-Term Optimism Premature?”
The VN-Index rebounded after testing the middle Bollinger Band, with trading volumes remaining below the 20-day average. This indicates a continued lack of liquidity in the market. Currently, the Stochastic Oscillator indicates a sell signal, and if the MACD follows suit in upcoming sessions, the risk of a market correction will increase.


