
I. MARKET ANALYSIS OF THE STOCK MARKET ON 02/20/2025
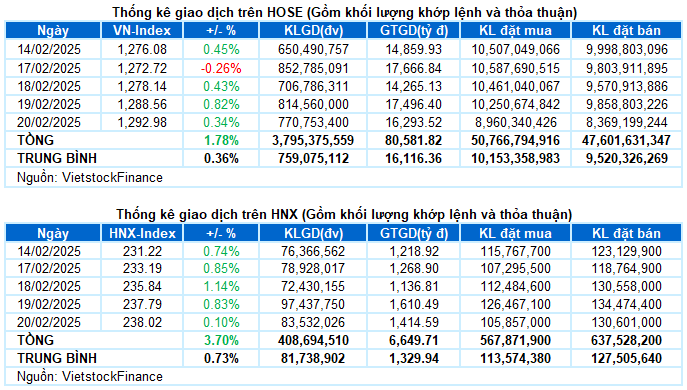
– The main indices maintained their green status during the trading session on February 20th. The VN-Index closed at 1,292.98 points, a 0.34% increase; while the HNX-Index slightly edged up by 0.1% to reach 238.02 points.
– The matching volume on the HOSE reached nearly 714 million units, a slight decrease of 3.1% compared to the previous session. On the HNX floor, the matching volume decreased by 14.1% to more than 62 million units.
– Foreign investors net sold on the HOSE with a value of over VND 456 billion and net bought over VND 62 billion on the HNX.
Trading value of foreign investors on HOSE, HNX and UPCOM by day. Unit: VND billion

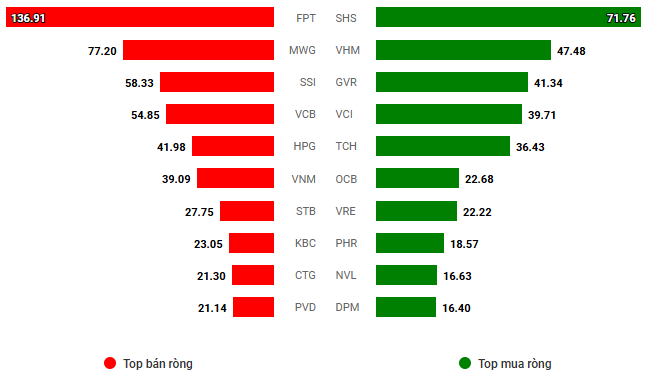
Net trading value by stock code. Unit: VND billion
– The stock market continued its positive momentum during the trading session on February 20th, despite the usual fluctuations on futures expiration day. Carrying over the enthusiastic sentiment from the previous session, the VN-Index opened in the green, with large-cap stocks playing a pivotal role in maintaining the market’s pace. Despite the increased profit-taking and cautious sentiment after the recent gains, the green status was firmly maintained until the end of the session. The VN-Index closed with a gain of 4.42 points, reaching the 1,292.98-point threshold.
– In terms of impact, VHM was the biggest highlight, contributing 1.5 points to the VN-Index‘s upward movement. This was followed by TCB, GVR, and VIC, which collectively added nearly 2 points to the index. Conversely, FPT, HVN, and LPB were the codes with the most negative impact, but they took away less than 1 point.
– The VN30-Index ended the session with a 0.36% increase, reaching 1,349.45 points. The buying force continued to dominate with 18 rising stocks, 7 falling stocks, and 5 stagnant stocks. Among them, VHM took the lead with an impressive 3.7% breakthrough, followed by GVR, TCB, MWG, BCM, and VIC, all of which also rose by more than 1%. On the other hand, LPB was the code that decreased the most in the basket, losing 1.1%.
Most industry groups closed in the green, but the performance was more differentiated. The materials group returned to the forefront after two previous adjustment sessions, leading the market with a gain of more than 2%. This was mainly driven by the upward momentum of GVR (+2.21%), DGC (+2.13%), HSG (+%), PHR (+6.39%), DPM (+1.36%), BMP (+1.19%), VCS (+1.71%), and especially the remarkable comeback of mining stocks such as KSV, MSR, HGM, BKC, BMC, and TMG.
In addition, real estate was also a notable highlight in the session. Apart from the standout performance of the Vingroup trio, including VHM (+3.71%), VIC (+1.36%), and VRE (+0.87%), many other stocks also left their mark, such as NVL, which hit the ceiling price, NLG (+1.08%), BCM (+1.54%), SCR (+1.13%), and NTC (+1.74%) . However, significant adjustments were witnessed in several stocks, including KBC (-1.16%), CEO (-2.74%), SZC (-1.12%), SIP (-1.04%), and HDC (-1.42%), among others.
On the flip side, information technology, energy, utilities, and telecommunications were the sectors dominated by red hues during today’s session.
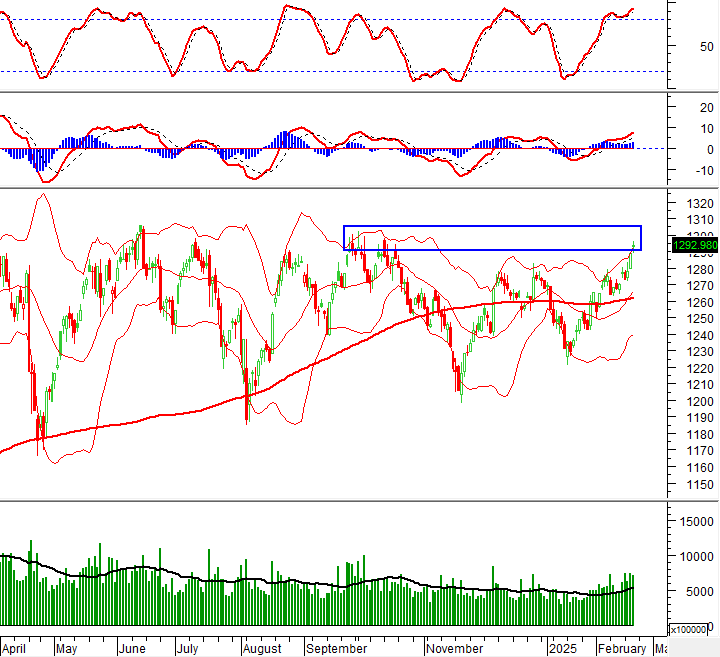
The VN-Index witnessed a slight increase and formed a Doji candlestick pattern. This indicates that the tug-of-war trend persists as the index retests the old peak of October 2024 (corresponding to the 1,290-1,305-point region). Going forward, the index needs to surpass this zone to sustain its upward trajectory. At present, the Stochastic Oscillator indicator is delving deeper into the overbought zone. Investors are advised to exercise caution in the upcoming period if the indicator flashes a sell signal again.
II. TREND AND PRICE MOVEMENT ANALYSIS
VN-Index – Doji Candlestick Pattern Emerges
The VN-Index witnessed a slight increase and formed a Doji candlestick pattern. This indicates that the tug-of-war trend persists as the index retests the old peak of October 2024 (corresponding to the 1,290-1,305-point region). To sustain its upward momentum, the index needs to surpass this zone in the future.
Presently, the Stochastic Oscillator indicator is delving deeper into the overbought zone. Investors are advised to exercise caution and closely monitor the indicator for any resurface of sell signals.
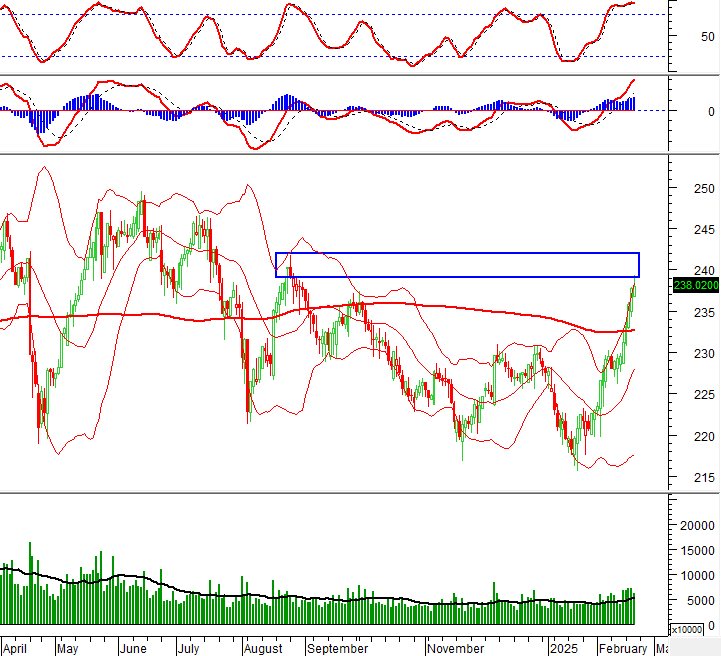
HNX-Index – Opportunities to Target the Old Peak Region of August 2024
The HNX-Index maintained its positive trajectory with eight consecutive gaining sessions, closely hugging the Upper Band of the Bollinger Bands. This reflects the current optimism among investors. At present, the index is poised to target the old peak region of August 2024 (corresponding to the 239-242-point zone). Should the index surpass this crucial threshold, the outlook will become even more promising.
However, the Stochastic Oscillator indicator is delving deeper into the overbought zone. If a sell signal reappears and the indicator falls out of this zone, the risk of adjustments will heighten.
Analysis of Capital Flows
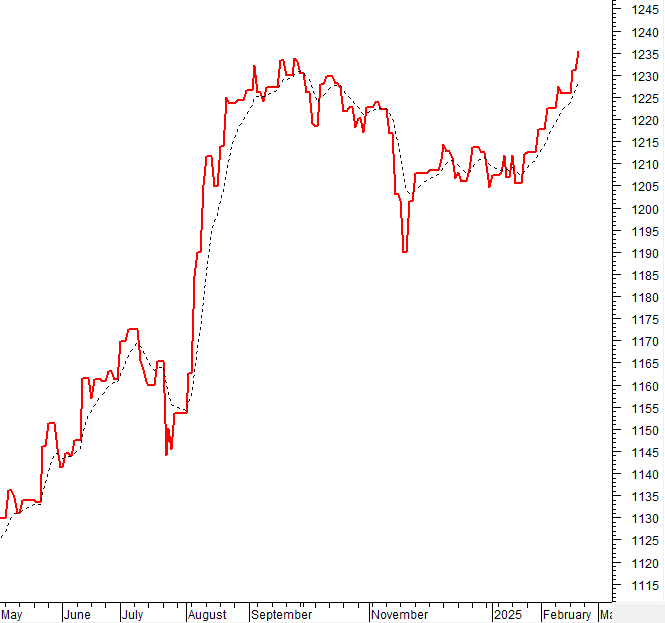
Fluctuations in Smart Money Flows: The Negative Volume Index indicator of the VN-Index cut above the EMA 20 line. If this status quo persists in the next session, the risk of sudden downturns (“thrust downs”) will be mitigated.
Fluctuations in Foreign Capital Flows: Foreign investors resumed net selling during the trading session on February 20, 2025. If foreign investors maintain this stance in the upcoming sessions, the outlook may turn less optimistic.
III. MARKET STATISTICS ON 02/20/2025
Department of Economic Analysis & Market Strategy Consulting, Vietstock Consulting
– 17:44 02/20/2025
Market Beat on Feb 21st: VN-Index Sees Strong Tug-of-War at the Almighty 1,300 Resistance

The market closed with the VN-Index up 3.77 points (+0.29%) to 1,296.75, while the HNX-Index fell 0.45 points (-0.19%) to 237.57. The market breadth tilted towards decliners, with 423 stocks falling versus 359 advancing stocks. The sell-off was more pronounced in the VN30 basket, with 18 gainers, 11 losers, and 1 stock referenced.
The Stock Market Week of February 17-21, 2025: Navigating Intensifying Foreign Investor Pressure

The VN-Index sustained a positive upward trajectory this week, with trading volumes above the 20-day average, indicating brisk investor activity. However, foreign investors continued their selling spree, maintaining a net selling position. If this trend persists, it could significantly impact the market as the VN-Index approaches the crucial resistance level of 1,300 points.
The Market Tug-of-War: Will the Stalemate Finally End?

The VN-Index rose while maintaining a tug-of-war stance following recent alternating sessions of gains and losses. Moreover, with trading volume remaining below the 20-day average, it indicates that investor caution is still prevalent. The Stochastic Oscillator indicator is also signaling a sell-off within the overbought territory, with a potential exit from this zone in the coming period. Should this occur, the risk of short-term corrections persists.
The Stock Market Week of February 10-14, 2025: Foreign Investors Continue Their Selling Spree

The VN-Index concluded a week of volatile trading with a modest gain. The index currently hovers above the 200-day SMA, and trading volume exhibits positive signs of improvement. This indicates a vibrant and active trading environment. However, the prolonged foreign selling streak could hinder the index’s growth trajectory in the coming period.
The Market Tug-of-War: Can the Bulls Break Free?

The VN-Index retreated, continuing its volatile movement as it retested the old peak of December 2024 (1,270-1,285 points). This threshold has proven to be a significant resistance level, as the index has repeatedly tested this zone recently. Presently, the Stochastic Oscillator is venturing deep into overbought territory. Should a sell signal emerge and the index falls out of this zone, the risk of a correction heightens in upcoming sessions.


