
BTC: Consolidation within the Fibonacci Projection range of 78.6%-100%
On the weekly chart, BTC maintains its long-term uptrend after successfully breaking above the November 2021 – March 2024 high (equivalent to the $65,800-$75,000 USD region).
Additionally, BTC formed a golden cross in December 2023, with the 50-day SMA crossing above the 100-day and 200-day SMAs. These moving averages continue to trend upward, indicating that the medium- and long-term uptrends remain intact. As such, the 100-day and 200-day SMAs are expected to act as strong support levels going forward.
However, BTC’s price action has been range-bound within the Fibonacci Projection range of 78.6%-100% (equivalent to the $95,200-$107,600 USD region) over the past two months. The MACD indicator is also narrowing its gap with the signal line, suggesting that the short-term momentum has slowed, and the risk of a downward correction may increase if a sell signal emerges.
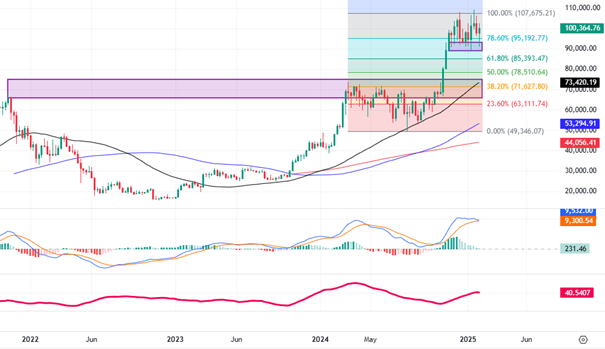
BTC chart for 2022 – 2025 – Source: TradingView
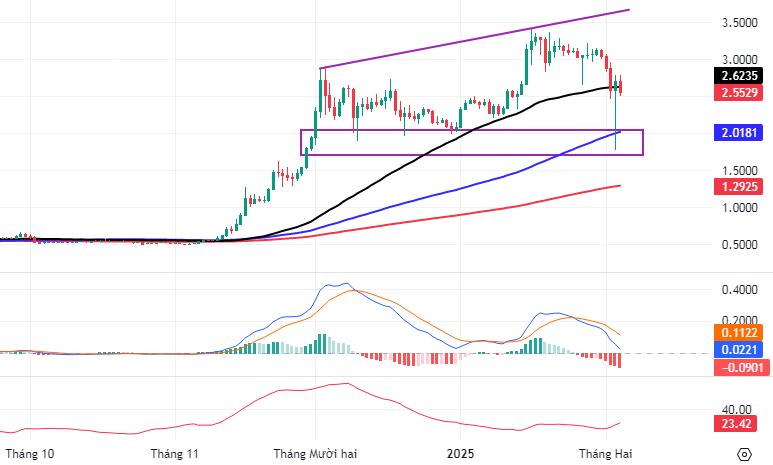
The near-term outlook turns less optimistic as both the MACD and Stochastic Oscillator have generated sell signals following a bearish divergence. Although the January 2025 low (around $89,000-$93,300 USD) has provided solid support for BTC in recent sessions, the current downward trajectory of the MACD suggests that the negative outlook may strengthen if it drops below the zero level in the coming days.
Based on these signals, we anticipate BTC to experience short-term volatility before resuming its long-term uptrend.
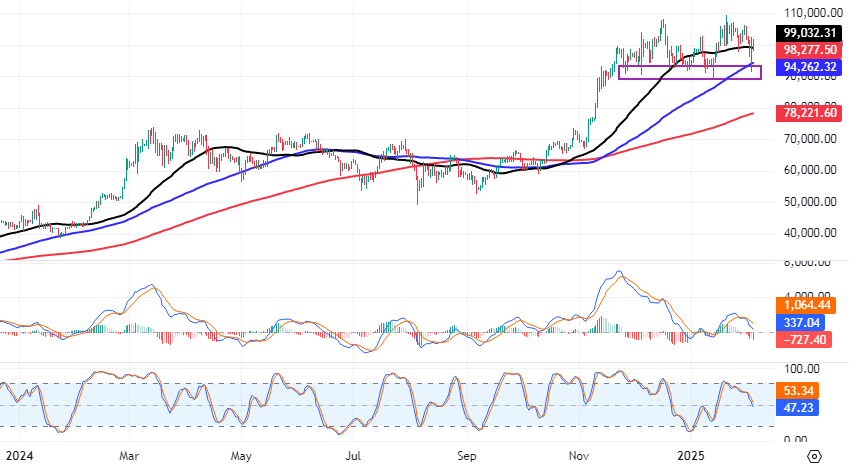
BTC chart for 2024 – 2025 – Source: TradingView
ETH: Re-testing the September 2024 low
On the weekly chart, ETH continues to trade within a long-term bullish price channel, indicating that the primary uptrend remains intact. However, ETH has dropped below the Middle Bollinger Band, and the Stochastic Oscillator is trending downward after generating a sell signal, suggesting that the short-term outlook remains negative.
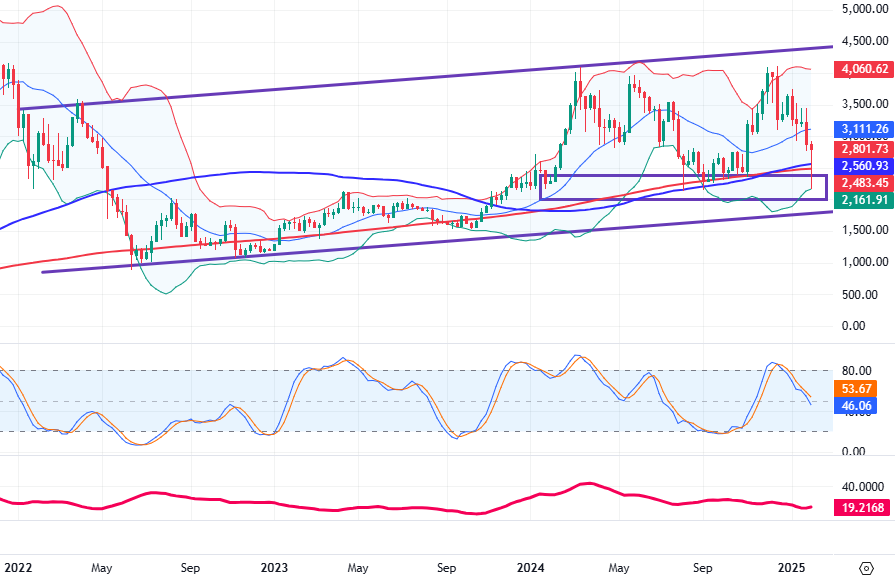
ETH chart for 2023 – 2025 – Source: TradingView
On the daily chart, ETH witnessed a sharp decline recently but quickly recovered and found support at the September 2024 low (around $2,010-$2,390 USD). Nonetheless, the MACD remains below the zero level and is trending downward after producing a sell signal, indicating a persistent bearish bias. With the ADX surpassing 25 and the 50-day and 100-day SMAs converging, the negative scenario is likely to extend into the medium term once the $2,010-$2,390 USD support zone is breached.
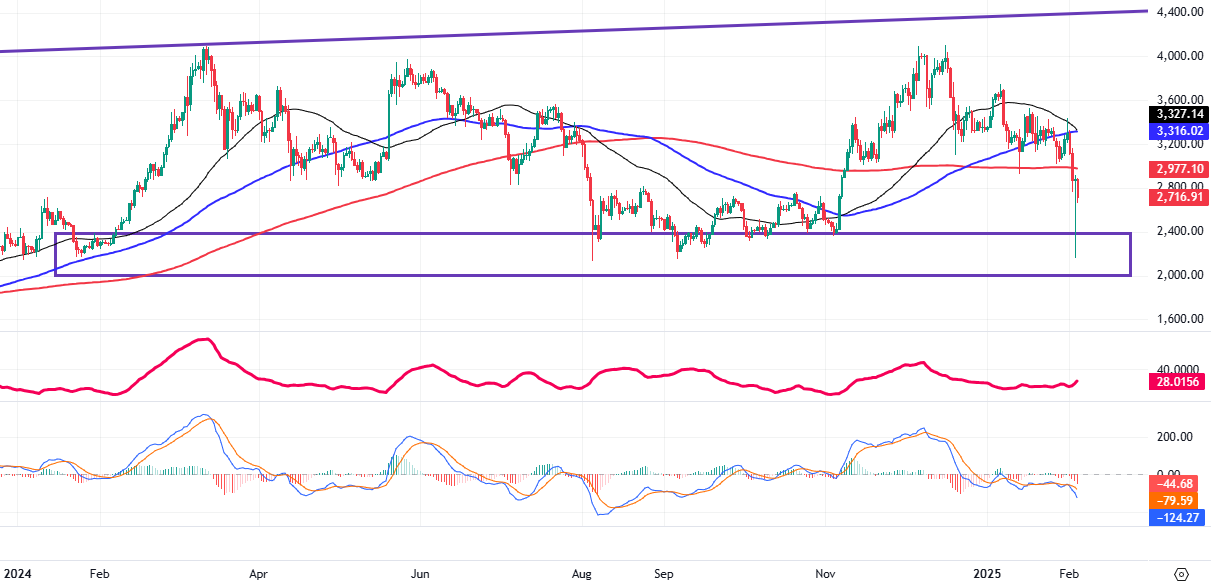
ETH chart for 2024 – 2025 – Source: TradingView
Given the emergence of short-term risk factors, investors are advised to refrain from trading at current levels and await more constructive signals before re-entering the market.
XRP: Short-term Consolidation
On the daily chart of XRP, a shakeout occurred as XRP retreated to test the 50-day SMA while the ADX oscillated within the gray area (20<>. Furthermore, both the MACD and Stochastic Oscillator are trending downward after concurrently producing sell signals, suggesting a lack of optimism in the near term. The December 2024 low (around $1.7-$2 USD) is expected to serve as the next support level for XRP if a corrective phase unfolds in the coming period.
XRP chart for 2024 – 2025 – Source: TradingView
In conclusion, we anticipate continued volatility and a potential short-term corrective phase for XRP. Investors should prioritize risk management and be prepared for adverse scenarios.
Technical Analysis Team, Vietstock Consulting
– 09:42 07/02/2025
The Market Tug-of-War: Vietstock Weekly Analysis 03-07/03/2025

The VN-Index continued its impressive upward trajectory, closely hugging the upper band of the Bollinger Bands. Accompanying this rise was a trading volume above the 20-week average, indicative of strong participation and a healthy flow of capital into the market. However, the index’s persistent volatility last week revealed that the 1,300-point mark is a significant resistance level. For the VN-Index to sustain its bullish momentum, breaking through this threshold in the coming period is essential.
The Art of Contrarian Investing: Navigating Market Swings with a Twist

The VN-Index has been on a rollercoaster ride lately, with alternating up and down sessions. Erratic trading volumes, fluctuating around the 20-day average, reflect investors’ unstable sentiment. However, the MACD and Stochastic Oscillator indicators continue to point upwards, providing a buy signal. If this status quo persists in the upcoming sessions, the short-term outlook may not be as risky as it seems.
“Unleashing the Power of Words: Vietstock Weekly 16-20/12/2024: Navigating Through Hidden Risks”

The VN-Index stalled after three consecutive weeks of gains, with trading volumes remaining below the 20-week average. This reflects a cautious sentiment among investors. Currently, the index sits above the Middle Bollinger Band. If it can sustain this level in the upcoming sessions, the outlook may not be as pessimistic.
The Power of Persuasive Writing: Crafting Compelling Headlines
“The Week Ahead: Uptrend Momentum Sustained”

The VN-Index extended its gains from the previous week, forming a bullish White Marubozu candlestick pattern. This indicates strong buying pressure as the index closed near its high. Additionally, the VN-Index has crossed above the 200-week SMA, reflecting a positive long-term outlook and an increasingly optimistic investor sentiment. However, the MACD indicator is currently showing a sell signal, and a drop below the zero line could trigger a short-term correction. If this occurs, the likelihood of a downward adjustment increases.
The Crypto Crash: Has the Bull Run on Digital Currencies Come to an End?

The Bitcoin rollercoaster has taken another wild turn, dragging other Altcoins down with it. This time, the dip is more significant, with a 4-7% drop across the board.

 – Short-Term Tug-of-War")


