


I. MARKET ANALYSIS OF THE STOCK MARKET BASED ON DATA FROM MARCH 19, 2025
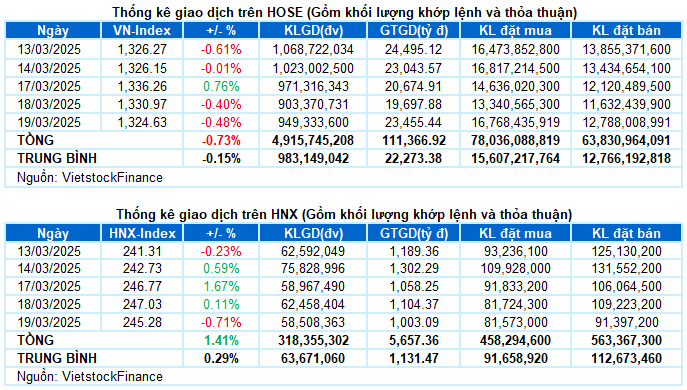
– The main indices witnessed a decline during the trading session on March 19. The VN-Index dropped by 6.34 points, or 0.48%, to reach 1,324.63; while the HNX-Index fell by 0.71% to 245.28.
– The HOSE saw an increase in trading volume, with nearly 836 million units traded, a 3.1% rise compared to the previous session. On the other hand, the trading volume on the HNX continued its downward trend, decreasing by 5.7% to over 45 million units.
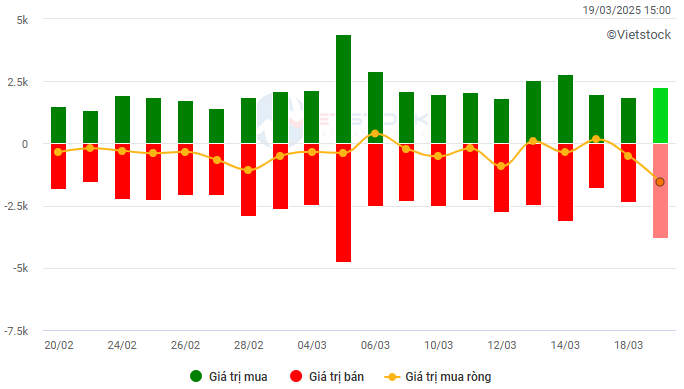
– Foreign investors engaged in net selling on the HOSE, with a value of more than 1,440 billion VND, and net sold nearly 77 billion VND on the HNX.
Trading value of foreign investors on HOSE, HNX and UPCOM for March 19, 2025. Unit: Billion VND
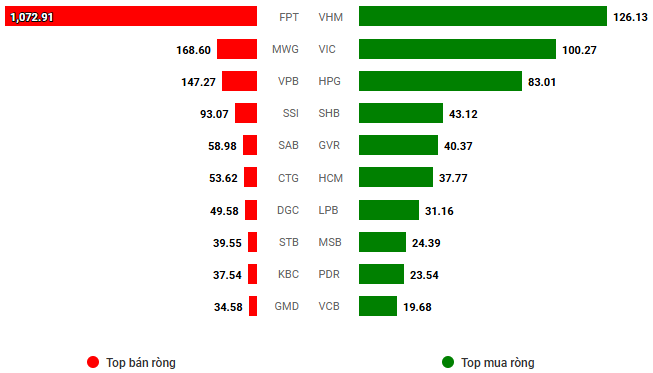
Net trading value by stock code. Unit: Billion VND
– The market experienced significant selling pressure on March 19, with a notable absence of support as the large-cap group underwent widespread adjustments. As a result, the VN-Index remained in negative territory throughout the trading session. Despite a late recovery attempt that helped to narrow the losses, it was insufficient to trigger a significant reversal. Moreover, the strong selling pressure from foreign investors further contributed to the cautious sentiment among investors regarding bottom-fishing. At the closing bell, the VN-Index settled at 1,324.63, marking a 0.48% decline from the previous session.
– In terms of impact, FPT exerted the most significant downward pressure, erasing nearly 2 points from the VN-Index. This was followed by MWG, VPB, and CTG, which collectively dragged the index down by nearly 2 additional points. Conversely, GVR, VIC, and LPB attempted to cushion the decline by contributing nearly 2.5 points to the VN-Index, but their efforts fell short in the face of widespread selling pressure.
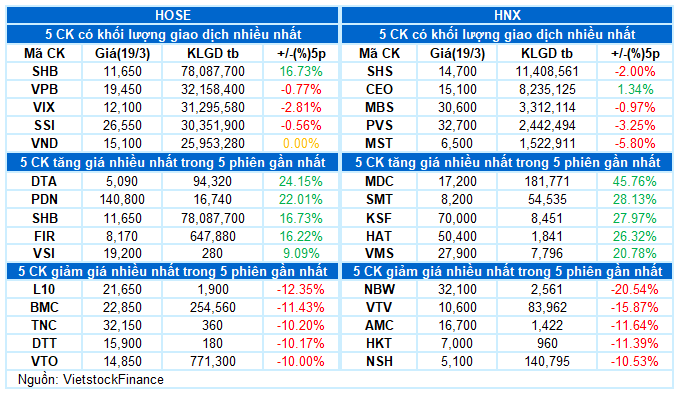
– The VN30-Index lost over 11 points, closing at 1,377.63. Sellers dominated the market, with 20 declining stocks, 8 advancing stocks, and 2 stocks remaining unchanged. Among them, FPT and MWG were the worst performers, plunging by 4.15% and 3.72%, respectively. A host of other stocks also witnessed corrections of over 1%, including VPB, MSN, HPG, BCM, TPB, and CTG. Conversely, GVR stood out with a remarkable gain of more than 4%, while LPB and VIC defied the bearish trend with increases of over 1%.
A sea of red engulfed most industry groups. The information technology group extended its losing streak as the “big brother” FPT (-4.15%) continued to face intense selling pressure from foreign investors. The telecommunications group suffered a similar fate, shedding over 2% with declines across major stocks such as VGI (-1.42%), CTR (-2.73%), FOX (-8.32%), FOC (-2.16%), YEG (-1.65%), TTN (-1.54%), and ELC (-2.83%). The non-essential consumer group also fell by more than 1% as heavy selling weighed on MWG (-3.72%), GEE (-4.62%), DGW (-2%), TNG (-2.69%), PET (-1.49%), VGT (-1.45%), and GIL (-1.43%), among others.
Amid the gloomy landscape, the healthcare group emerged as a bright spot, with numerous stocks surging strongly. IMP hit the daily limit-up, while DVN, DTP, DBD, FIT, PBC, and OPC all soared by over 2%, attracting considerable buying interest. Additionally, the substantial contributions from GVR (+4.19%), PHR (+3.21%), DPR (+1.95%), PTB (+1.88%), and DGC (+0.56%) helped the materials group regain its footing and turn positive by the end of the session.
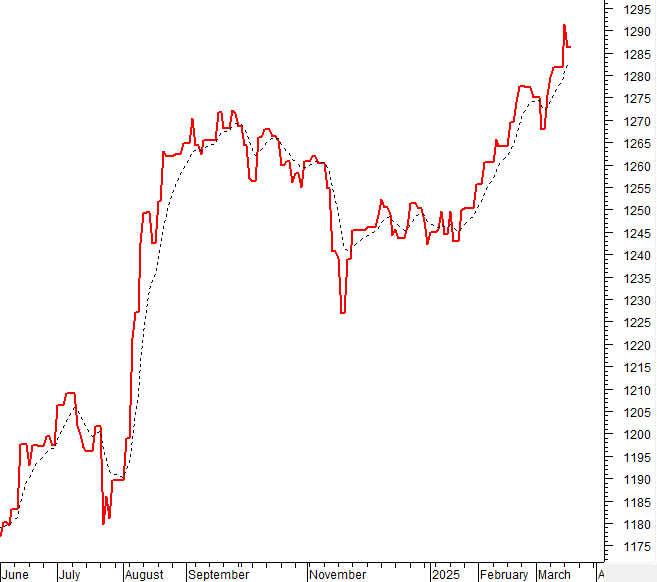
The VN-Index continued its downward trajectory, with trading volume remaining below the 20-day average. This indicates a heightened sense of caution among investors as the index approaches the old peak surpassed in June 2024 (corresponding to the 1,290-1,310 range). At present, the Stochastic Oscillator indicator is signaling a sell and exiting the overbought zone. Similarly, the MACD indicator is conveying a comparable message. Investors are advised to exercise prudence in their investment decisions if the corrective phase persists.
II. TREND AND PRICE MOVEMENT ANALYSIS
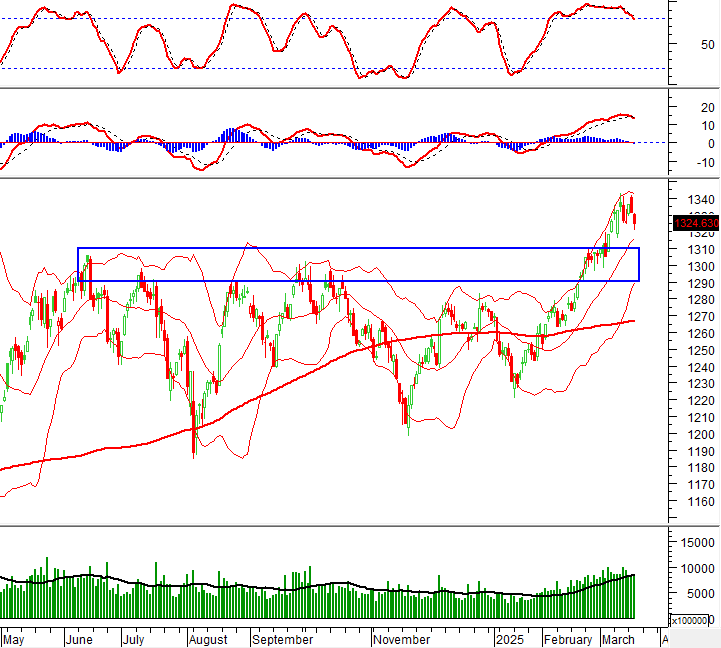
VN-Index – Stochastic Oscillator and MACD Indicators Signal a Sell
The VN-Index extended its decline, with trading volume remaining below the 20-day average. This suggests that investor caution is heightened as the index approaches the old peak surpassed in June 2024 (approximately the 1,290-1,310 range).
Presently, the Stochastic Oscillator indicator is signaling a sell and exiting the overbought zone. Similarly, the MACD indicator is conveying a comparable message. Investors are advised to exercise caution in their investment decisions if the corrective phase persists.
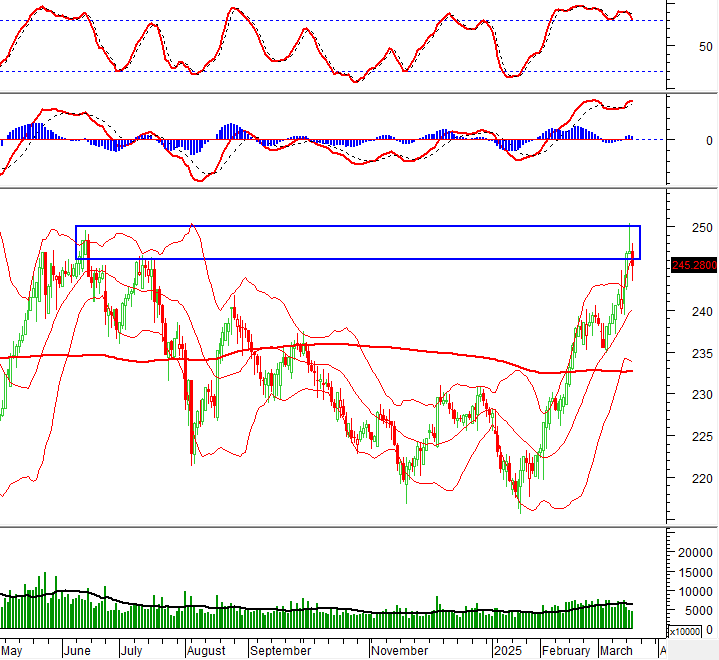
HNX-Index – Volume Plunges Below the 20-Day Average
The HNX-Index resumed its downward trajectory after trading volume consistently declined below the 20-day average in recent sessions. This reflects investor caution as the index retests the old peak from June 2024 (approximately the 246-250 range).
At present, the Stochastic Oscillator indicator is signaling a sell within the overbought zone and may exit this zone in the upcoming sessions. Should this occur, the short-term outlook will become even more pessimistic.
Money Flow Analysis
Movement of Smart Money: The Negative Volume Index indicator of the VN-Index crossed above the EMA 20 line. If this condition persists in the next session, the risk of a sudden plunge (thrust down) will be mitigated.
Foreign Capital Flow: Foreign investors continued net selling during the trading session on March 19, 2025. If foreign investors maintain this stance in the coming sessions, the situation will become even more pessimistic.
III. MARKET STATISTICS FOR MARCH 19, 2025
Analysis and Strategy Department, Vietstock Consulting and Investment
– 17:13 19/03/2025
Market Beat: Green Dominance, VN-Index Nears 1,270 Points

The market ended the session on a positive note, with the VN-Index climbing 4.93 points (0.39%) to reach 1,269.61; the HNX-Index also rose, by 1.37 points (0.6%), closing at 227.98. The market breadth tilted slightly in favor of the bulls, with 451 gainers against 255 decliners. The VN30 basket saw a relatively balanced performance, with 15 gainers, 14 losers, and 1 stock finishing unchanged.
Market Beat on Feb 24th: VN-Index Surges Past 1,300 Points as Trading Volume Improves

The market closed with strong gains, as the VN-Index rose by 7.81 points (+0.6%), finishing at 1,304.56; while the HNX-Index climbed 0.92 points (+0.39%) to close at 238.49. The market breadth was relatively balanced, with 377 gainers and 373 losers. The large-cap stocks in the VN30 basket painted a positive picture, as 21 stocks advanced, 6 declined, and 3 remained unchanged, tilting the basket towards a green close.
The Market Beat – 28/02: Foreigners’ Robust Sell-off Continues in the Final Trading Session of February

The market closed with slight losses, as the VN-Index dipped by 2.44 points (-0.19%) to end the day at 1,305.36. Similarly, the HNX-Index edged lower by 0.2 points (-0.08%), finishing at 239.19. The market breadth tilted towards decliners, with 408 tickers in the red versus 390 in the green. The large-cap segment mirrored this sentiment, as reflected in the VN30 basket, where 18 stocks retreated, seven advanced, and five remained unchanged.
Is the Uptrend Supported?

The VN-Index rebounded with a Hammer candlestick pattern, reflecting investors’ optimism as the index broke through the old peak of October 2024 (1,290-1,305 points). This bullish sentiment is further reinforced by the MACD indicator, which continues to trend upward, providing a buy signal. If the index sustains levels above this threshold, accompanied by high trading volume, the upward trajectory will be solidified.
Steady Growth Surge: Vietstock Daily’s Insight for 25/02/2025

The VN-Index has been on a remarkable run recently, with five consecutive sessions in the green, closely hugging the upper band of the Bollinger Bands. What’s more, the index is retesting the old peak from October 2024 (1,290-1,305 points) amid sustained trading volumes above the 20-day average, indicating consistent participation from investors. Should the VN-Index decisively breach this zone, the outlook would turn even more bullish. However, the Stochastic Oscillator, now deeply embedded in overbought territory, suggests that the risk of a correction will heighten if sell signals reemerge.


