


 – Short-Term Tug-of-War")


 – BTC’s Historic Summit Challenge")


I. MARKET ANALYSIS OF STOCKS AS OF JUNE 23, 2025
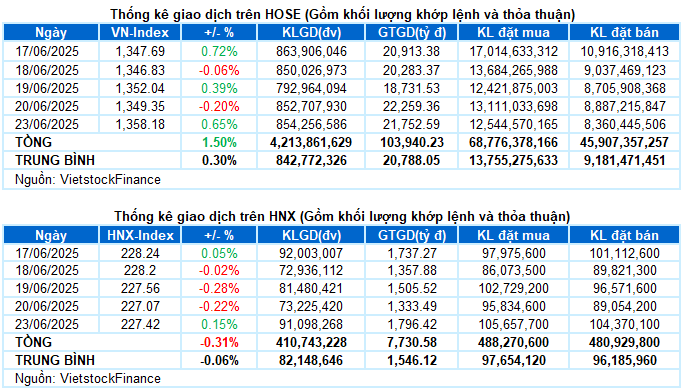
– The main indices turned green during the first trading session of the week. VN-Index increased by 0.65%, reaching 1,358.18 points. HNX-Index settled at 227.42 points, a slight increase of 0.15%.
– The trading volume on the HOSE floor slightly increased by 0.2%, surpassing 854 million units. Meanwhile, the HNX floor recorded 91 million units, a 24.4% surge compared to the previous session.
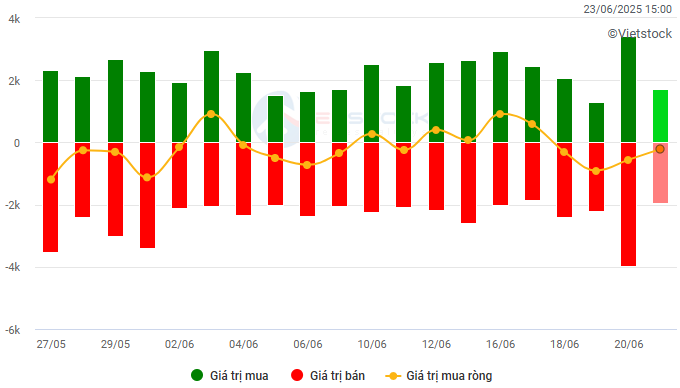
– Foreign investors net sold over VND 147 billion on the HOSE and more than VND 44 billion on the HNX.
Trading value of foreign investors on HOSE, HNX, and UPCOM. Unit: VND billion
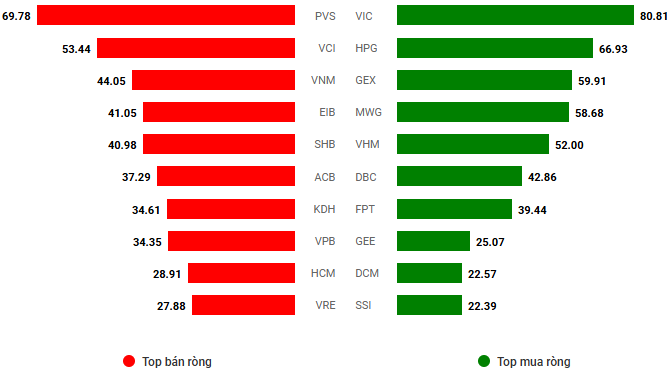
Net trading value by stock code. Unit: VND billion
– The stock market started the new week with an unexpected drop of more than 10 points, but the support from the pillar group quickly helped VN-Index recover to near the reference level afterward. However, selling pressure remained dominant, causing the index to fluctuate and mostly trade in the red throughout the morning session. In the afternoon session, a few large caps accelerated strongly, leading VN-Index back to the uptrend and maintaining the green territory until the market closed. VN-Index continued to hit a new peak for the year 2025 at 1,358.18 points, an increase of nearly 9 points compared to the previous week.
– In terms of impact, VIC was the brightest spot, contributing up to 5.7 points to the gain. Following were VHM and GAS, which brought about 3.8 points and 1.7 points to VN-Index, respectively. On the other hand, VCB and HVN had the most negative influence, taking away only 1.5 points from the overall index.
– Pillar stocks were the main factor contributing to the market’s positive performance today. VN30-Index ended the session up 0.91%, reaching 1,448.32 points. Although the number of declining stocks slightly outnumbered the advancing ones, with 18 decreasing and 12 increasing, only 3 codes VJC, VNM, and SSI witnessed a drop of more than 1%. On the rising side, VIC took the lead with a purple hue, followed by VHM and GAS with outstanding gains of over 4%, while BCM, GVR, and MWG also rose by more than 2%.
Sectors showed clear differentiation. Real estate led the market with an impressive increase of 3.45%, thanks mainly to VIC hitting the ceiling price, VHM (+5.41%), BCM (+2.56%), KBC (+1.17%), NLG (+1.4%), IDC (+2.9%), SIP (+4.85%), CEO (+3.35%), etc. However, many stocks in this sector were still dominated by red, losing more than 1% like SSH, KDH, NVL, DXG, TCH, DIG, and VCR.
Moreover, energy and utilities groups also traded positively amid strong fluctuations in the energy market due to escalating tensions in the Middle East. Numerous stocks attracted strong buying demand, typically PVC hitting the ceiling price, BSR (+2.17%), PVS (+1.15%), PVD (+3.09%), POS (+5.26%), PVB (+1.94%); GAS (+4.46%), QTP (+1.52%), NT2 (+3.01%), GEG (+1.52%),…
In contrast, the telecommunications group ranked last in the first session of the week, decreasing by 1.31%, mainly due to the adjustment of VGI (-1.66%), FOX (-0.81%), YEG (-2.79%), ELC (-1.57%), and TTN (-1.18%).
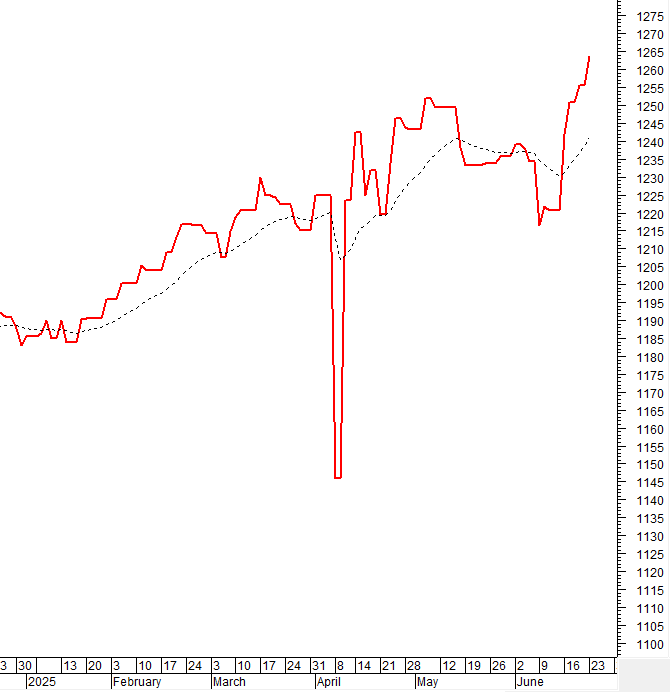
VN-Index surged after successfully testing the Middle line of the Bollinger Bands. However, liquidity has not shown improvement, with the trading volume remaining below the 20-day average, reflecting investors’ cautious sentiment. Currently, the MACD indicator has given a buy signal again, which will reinforce the short-term outlook if cash flow soon converges in the following sessions.
II. TREND AND PRICE MOVEMENT ANALYSIS
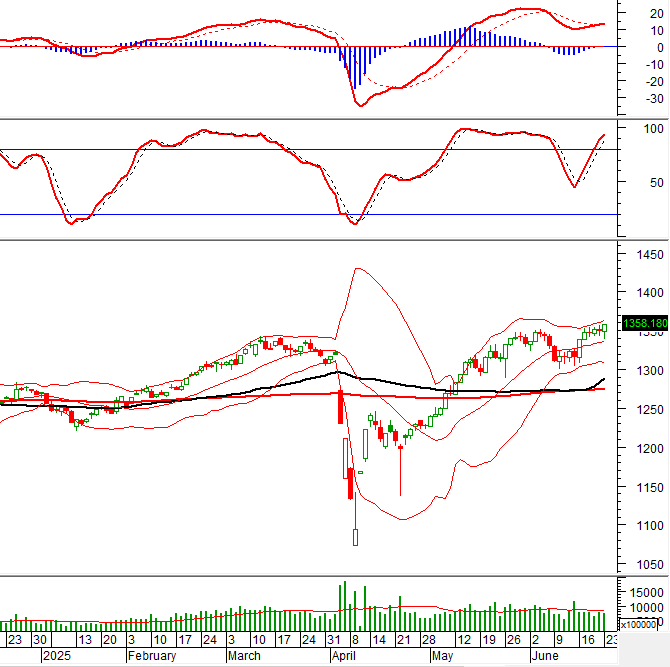
VN-Index – MACD indicator gives a buy signal
VN-Index surged after successfully testing the Middle line of the Bollinger Bands. However, liquidity has not shown much improvement, with the trading volume remaining below the 20-day average, reflecting investors’ cautious sentiment.
Currently, the MACD indicator has given a buy signal again, which will reinforce the positive short-term outlook if cash flow soon converges in the following sessions.
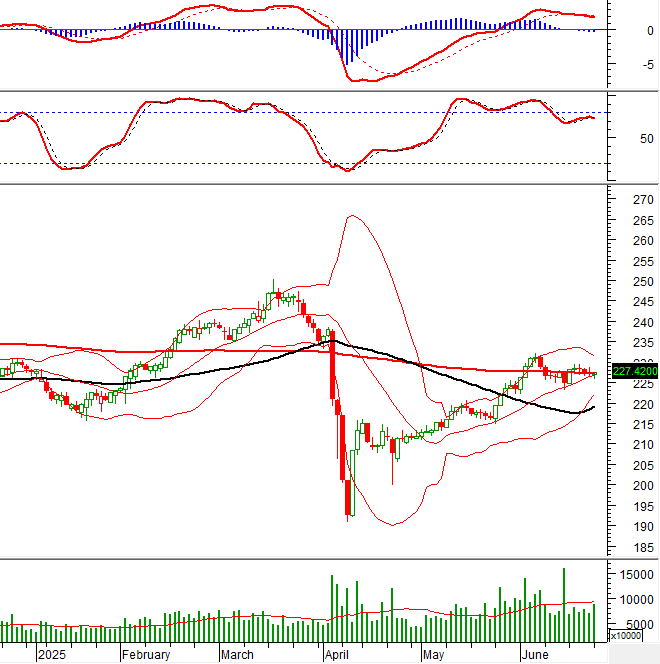
HNX-Index – Stochastic Oscillator indicator gives a sell signal
HNX-Index slightly increased after fluctuating during the session and remained above the Middle line of the Bollinger Bands.
However, the Stochastic Oscillator indicator has given a sell signal again, while the MACD indicator also continued to point downward after giving a sell signal. This suggests that the short-term fluctuation pressure will likely persist.
Money Flow Analysis
Movement of smart money: The Negative Volume Index indicator of VN-Index cut above the EMA 20 days. If this status continues in the next session, the risk of an unexpected drop (thrust down) will be limited.
Foreign capital flow: Foreign investors continued to net sell during the trading session on June 23, 2025. If foreign investors maintain this action in the coming sessions, the situation will become more pessimistic.
III. MARKET STATISTICS AS OF JUNE 23, 2025
Economic and Market Strategy Division, Vietstock Consulting
– 17:15 23/06/2025
Technical Analysis for June 23: A Session of Tug-of-War

The VN-Index and HNX-Index both opened lower, with an increase in trading volume during the morning session, indicating that the market trend remains uncertain.
Technical Analysis for June 24: Positive Signals Emerge

The VN-Index and HNX-Index opened higher, with a surge in trading volume during the morning session, indicating a positive sentiment among investors.
Market Beat: Foreigners Turn Buyers

Closing the trading session, VN-Index surged by 8.5 points, reaching 1,366.77, while the HNX-Index witnessed a modest gain of 0.37 points, ending the day at 227.79.
Stock Trading Leadership: Revving Up!

The trading statistics for the week of June 16-20, 2025, revealed a vibrant resurgence in transactions by executives and their affiliates. Notably, substantial trading activities were observed at APG, CTX, and HAG, indicating a lively comeback in both execution and registration across the board.
Building the Nation: Why Construction Stone Stocks are the Unsung Heroes of Infrastructure Investments

The construction stone industry is witnessing a stellar performance from several of its stocks in the first half of 2025, even as the wave of public investment has yet to fully take hold across the market.


