


: Mixed Signals Emerge")

: Short-Term Outlook Continues to Deteriorate")

I. MARKET ANALYSIS OF SECURITIES ON AUGUST 5, 2025
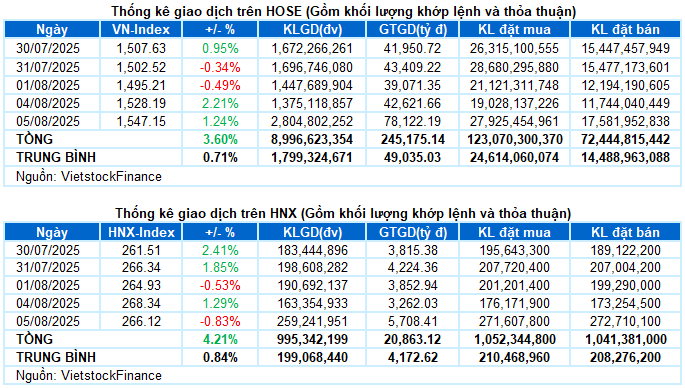
– The main indices traded mixed on August 5. Specifically, VN-Index increased by 1.24%, reaching 1,547.15 points. Meanwhile, HNX-Index decreased by 0.83% to 266.12 points.
– The matching volume on the HOSE reached 2.7 billion units, 2.2 times higher than the previous session. The HNX also recorded more than 258 million units, an increase of 60.6%.
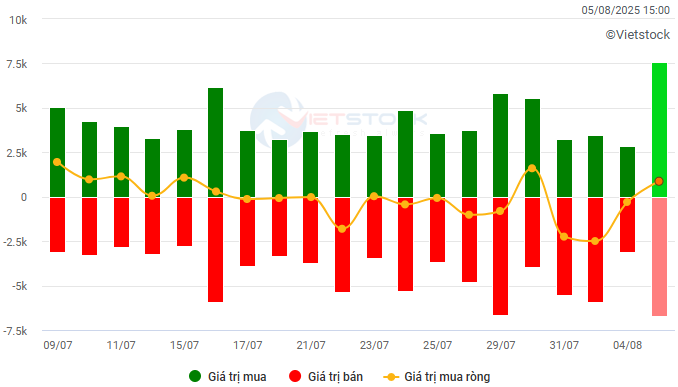
– Foreign investors net bought with a value of more than VND 615 billion on the HOSE and VND 271 billion on the HNX.
Trading value of foreign investors on HOSE, HNX and UPCOM by day. Unit: VND billion
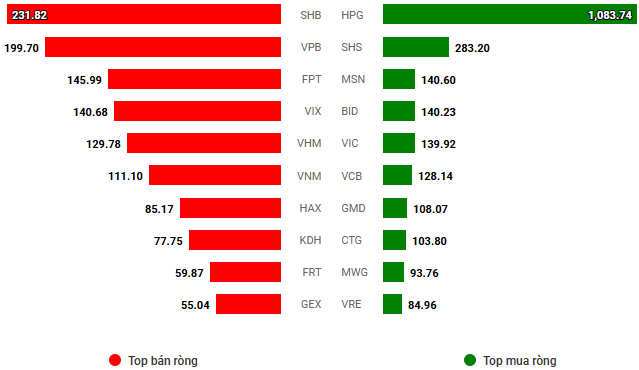
Net trading value by stock code. Unit: VND billion
– In the trading session on August 5, strong buying force focused on pillar sectors such as finance and real estate, helping VN-Index to open with an increase of more than 20 points. The upward momentum spread widely, pushing the index to a new high, almost reaching the threshold of 1,585 points in the afternoon session. However, a big surprise happened after 2 pm when strong profit-taking pressure pushed the VN-Index down sharply, even erasing all gains and falling below the reference level just before the ATC session. Nevertheless, the VN-Index recovered partially and closed at 1,547.15 points, up 1.24% from the previous session.
– In terms of impact, VIC continued to play a leading role, contributing 6 points to the VN-Index. Following were VHM, MBB, and TCB, which also added a total of more than 9 points. On the other hand, BCM and SSB were the two codes with the most negative impact, but they also took away less than 1 point from the overall index.
– VN30-Index increased strongly by 2.25% to 1,690.43 points. Buyers remained dominant with 19 rising codes, 9 falling codes, and 2 stagnant codes. In particular, MBB maintained its outstanding purple color until the end of the session, followed by VRE, VIC, and TPB, which also recorded outstanding gains of more than 5%. On the other hand, SSB and BCM went against the general trend with a strong adjustment of more than 3%.
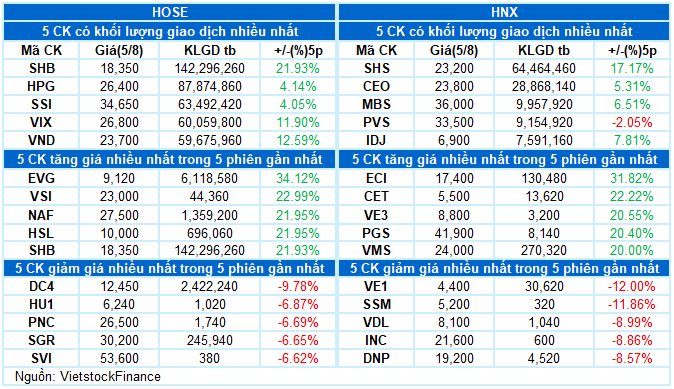
The sectors performed quite differently. Real estate remained the market leader with an outstanding increase of 2.84%. In addition to the VinGroup trio, cash flow also went to many notable stocks such as KBC (+2.85%), VPI (+1.52%), NTL (+2.31%), and EVG hitting the ceiling price. However, profit-taking pressure also started to increase, causing many stocks in this sector to fall by more than 2%, including NVL, BCM, HDC, HQC, DXS, QCG, LDG, TAL, and SJS.
In addition, the financial group also contributed significantly to the overall market with outstanding performances from banking and securities stocks such as MBB hitting the ceiling price, TCB (+4.67%), SSI (+1.91%), STB (+3.4%), TPB (+5.07%), CTG (+1.86%), BID (+1.84%), VCI (+2.58%), and VND (+1.94%).
On the opposite side, the information technology group continued to be the “bottom” with a decrease of 0.85%, as typical stocks such as FPT (-0.75%), ELC (-3.76%), DLG (-4.86%), HPT (-14.66%), VEC (-4.42%), and ITD (-4.01%) remained subdued. The utilities group also recorded widespread red lights, notably POW (-1.69%), NT2 (-1.37%), GEG (-4.44%), DL1 (-2.74%), and BWE (-3.45%).
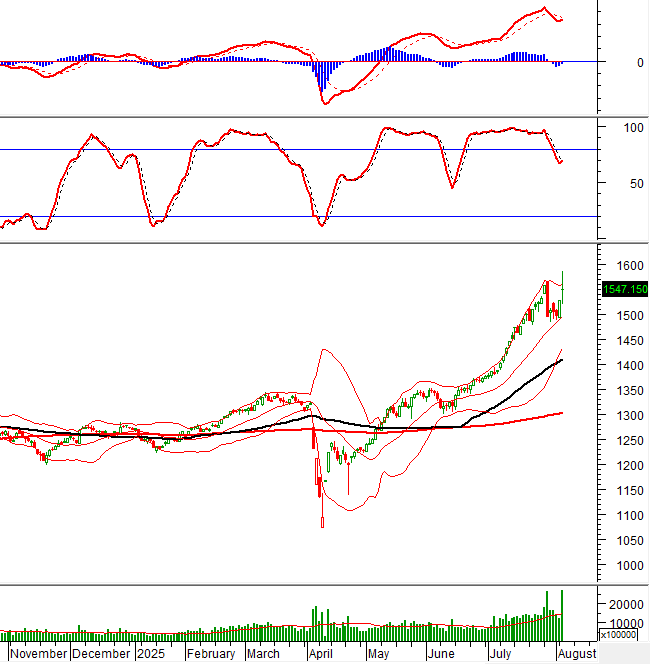
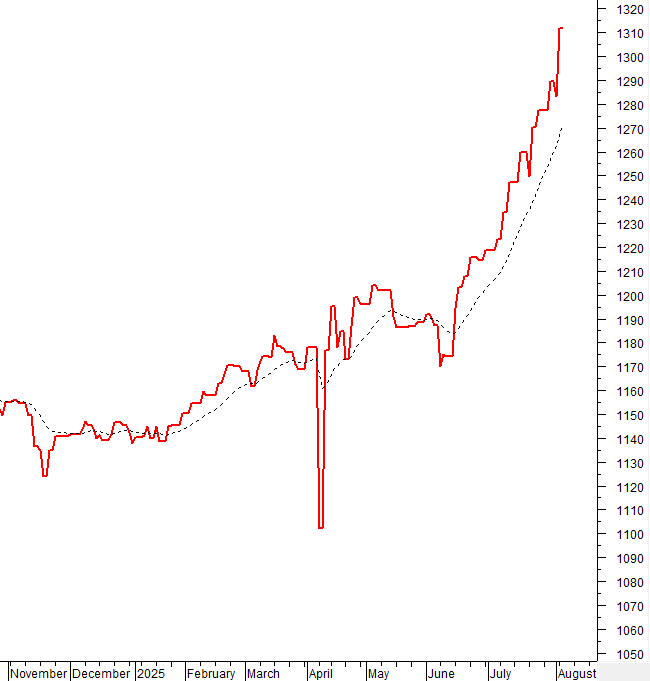
VN-Index fluctuated strongly towards the end of the session and formed a Doji candlestick pattern, reflecting the tug-of-war between buyers and sellers at high prices. Trading volume continued to set a new record, indicating strong participation from cash flow. Currently, the Stochastic Oscillator indicator has given a buy signal again, while MACD is narrowing the gap with the Signal line. If the buy signal is confirmed in the next sessions, the positive outlook in the short term is likely to continue.
II. TREND AND PRICE MOVEMENT ANALYSIS
VN-Index – Doji candlestick pattern appears
VN-Index fluctuated strongly towards the end of the session and formed a Doji candlestick pattern, reflecting the tug-of-war between buyers and sellers at high prices. Trading volume continued to set a new record, indicating strong cash flow participation.
Currently, the Stochastic Oscillator indicator has given a buy signal again, while MACD is narrowing the gap with the Signal line. If the buy signal is confirmed in the next sessions, the positive outlook in the short term is likely to be maintained.
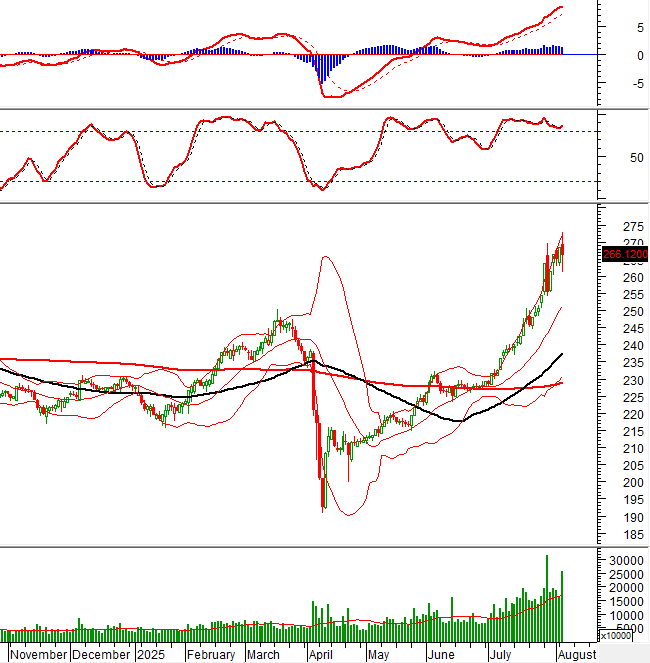
HNX-Index – Stochastic Oscillator indicator gives a buy signal again
HNX-Index decreased and formed a candlestick pattern similar to a High Wave Candle, reflecting the existing tug-of-war situation.
However, the short-term upward trend of the index was maintained, while the Stochastic Oscillator indicator gave a buy signal again and has not left the overbought area, indicating that the positive outlook is being supported.
Analysis of Cash Flow
Changes in Smart Money Flow: The Negative Volume Index indicator of VN-Index is currently above the EMA 20 day. If this situation continues in the next session, the risk of an unexpected drop (thrust down) will be limited.
Changes in cash flow from foreign investors: Foreign investors net bought in the trading session on August 5, 2025. If foreign investors maintain this action in the coming sessions, the situation will become more optimistic.
III. MARKET STATISTICS ON AUGUST 5, 2025
Economic and Market Strategy Analysis Department, Vietstock Consulting
– 17:15 08/05/2025
Market Beat July 29: Profit-taking Pressure Mounts, VN-Index Down 64 Points

The selling pressure intensified during the afternoon session, driving the market deeper into negative territory. The downward trend gained momentum towards the closing bell, with the VN-Index plunging 64 points to close at 1,493.41. The HNX-Index also witnessed a sharp decline, falling over 8 points to end the day at 255.36.
Market Beat Aug 01: Caution Creeps In, VN-Index Wobbles at 1,500 Mark

The trading session concluded with the VN-Index shedding 7.31 points (-0.49%), settling at 1,495.21. Likewise, the HNX-Index witnessed a decline of 1.41 points (-0.53%), closing at 264.93. The market breadth tilted towards decliners, as 423 stocks closed in the red versus 366 advancers. The VN30 basket echoed a similar sentiment, with 15 stocks losing ground, 10 advancing, and 5 remaining unchanged.
The Vietstock Daily: Record-Breaking Volumes Signal a Market Turnaround

The VN-Index plummeted over 64 points, accompanied by the emergence of a Black Marubozu candlestick pattern. Trading volume surged to a record high, and the number of declining stocks far outweighed those advancing, clearly reflecting the widespread panic and selling pressure across the market. As of now, the Stochastic Oscillator has given a fresh sell signal within the overbought region. Concurrently, the MACD is narrowing its gap with the Signal line, and the outlook will turn even more pessimistic if a sell signal is confirmed in the upcoming sessions.
Market Beat July 22: VN-Index Surges Past 1,500

The market rallied in the latter half of the morning session and sustained its upward momentum until the end of the trading day. The VN-Index soared past the 1,500-point mark, closing at 1,509.54—a gain of over 24 points. The HNX-Index also saw a boost, rising by 2 points to close at 247.85.
Bullish Momentum Returns

The VN-Index staged a remarkable recovery, decisively erasing the previous day’s losses and showcasing the swift return of bullish momentum after a brief technical correction. Trading volume remained above the 20-session average, despite a slight dip, indicating sustained investor interest. This dynamic development negates the earlier bearish signal and paves the way for a potential push towards the historic peak of 1,530 points. Moreover, the MACD indicator continues its upward trajectory since the buy signal in mid-June 2025, reinforcing the positive outlook in the near term.


