


: Mixed Signals Emerge")

: Short-Term Outlook Continues to Deteriorate")

I. MARKET ANALYSIS OF STOCKS AS OF JULY 21, 2025
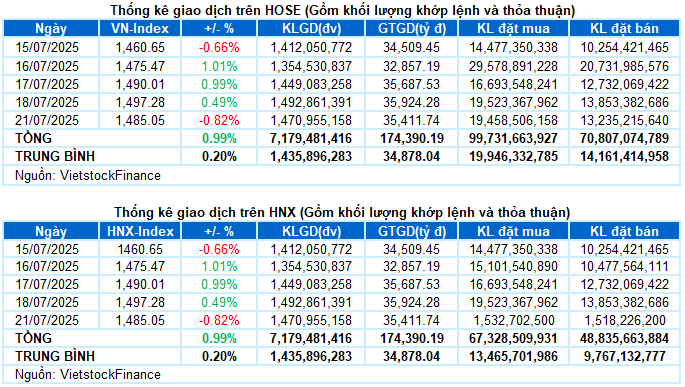
– The main indices turned downward during the July 21 trading session. Specifically, VN-Index settled at 1,485.05 points, down 0.82%; HNX-Index decreased by 0.8%, closing at 245.79 points.
– The trading volume on the HOSE decreased by 4.8%, reaching over 1.3 billion units. The HNX also recorded more than 151 million units, a 14.7% drop compared to the previous session.
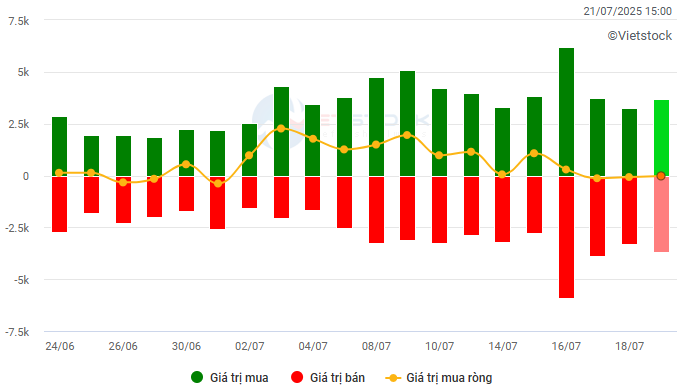
– Foreign investors returned to net buying with a slight value of VND 23 billion on the HOSE and VND 13 billion on the HNX.
Trading value of foreign investors on HOSE, HNX and UPCOM. Unit: VND billion
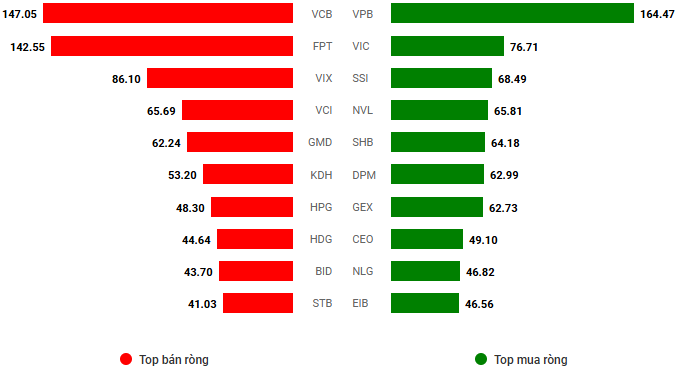
Net trading value by stock code. Unit: VND billion
– Despite a positive opening with an increase of nearly 12 points, the VN-Index soon faced selling pressure, causing the gain to narrow. The tug-of-war continued in the morning session with alternating increases and decreases, and the index even turned red before the lunch break due to strong profit-taking in securities and real estate stocks, which had performed well previously. The afternoon session remained volatile around the reference level, but high selling pressure at the end of the session pushed the index into a steep decline. At the end of the first session of the week, the VN-Index lost more than 12 points compared to the previous week, retreating to 1,485.05 points.
– In terms of impact, VIC was the stock that put the most pressure on the VN-Index, taking away nearly 6 points. This was followed by VHM, TCB, and VCB, which caused the index to drop by more than 6 points. Meanwhile, VPB and HVN made the most positive contributions, helping the VN-Index regain about 3 points, but it was still not enough to offset the overwhelming selling pressure from many other large-cap stocks.
– The VN30-Index closed with a sharp decline of nearly 1%, falling to 1,628.06 points. The breadth was negative with 17 declining stocks, 12 advancing stocks, and 1 stock closing unchanged. VIC led the decline with a nearly 6% drop, followed by VHM, TCB, and MSN, which all adjusted more than 2%. On the other hand, VPB stood out with a 4.4% increase, while SHB and LPB also recorded positive gains of nearly 3%.
The market witnessed a clear differentiation among industry groups. Real estate and media services were the two sectors that faced the strongest selling pressure, falling more than 2% with widespread red across the board, notably VIC (-5.88%), VHM (-4.17%), VRE (-1.53%), NVL (-2.36%), KDH (-2.59%), DXG (-2.83%), PDR (-2.68%), CEO (-3.1%); VGI (-1.47%), FOX (-4.7%), VNZ (-2.96%), CTR (-1.8%), and FOC (-2.97%).
In addition, securities stocks also faced strong selling pressure, with a series of codes falling deeply, such as VCI (-2.52%), VND (-2.16%), MBS (-1.66%), BSI (-3.29%), SHS (-2.39%), FTS (-2.68%), VDS (-4.35%), and AGR (-2.74%). Only a few codes managed to stay in the green, including VIX (+2.39%), CTS (+4.21%), and EVS (+2.9%).
In contrast, the materials sector became a bright spot, rising nearly 1% led by HPG (+1.16%), MSR (+4.33%), DCM (+1.92%), DPM (+3.65%), TVN (+2.56%), HT1 (+5.77%), DPR (+3.42%), CSV (+1.4%), and DHA (+1.78%).
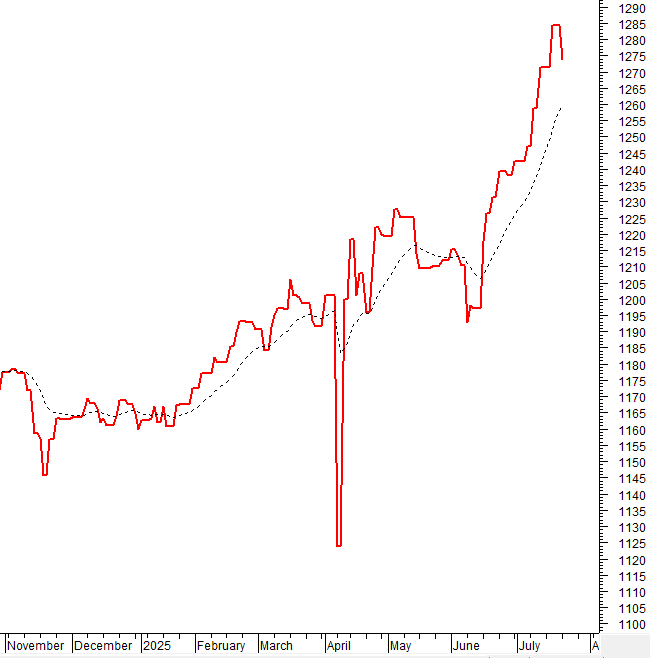
The VN-Index declined and formed a Bearish Engulfing candlestick pattern after failing to overcome the psychological resistance level of 1,500 points, indicating strong profit-taking pressure. Additionally, the Stochastic Oscillator indicator has given a sell signal in the overbought zone. Investors should exercise caution in the coming period if the indicator falls out of this zone, as the short-term correction pressure will likely increase.
II. TREND AND PRICE MOVEMENT ANALYSIS
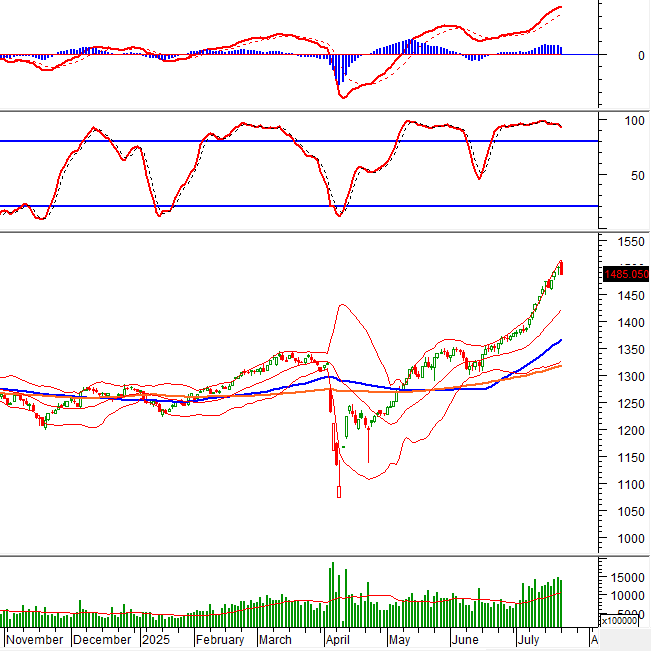
VN-Index – Bearish Engulfing Pattern Emerges
The VN-Index declined and formed a Bearish Engulfing candlestick pattern after failing to surpass the psychological resistance level of 1,500 points, suggesting strong profit-taking pressure.
Additionally, the Stochastic Oscillator indicator has issued a sell signal within the overbought zone. Investors should remain cautious in the near future if the indicator falls out of this zone, as the short-term downward pressure will likely intensify.
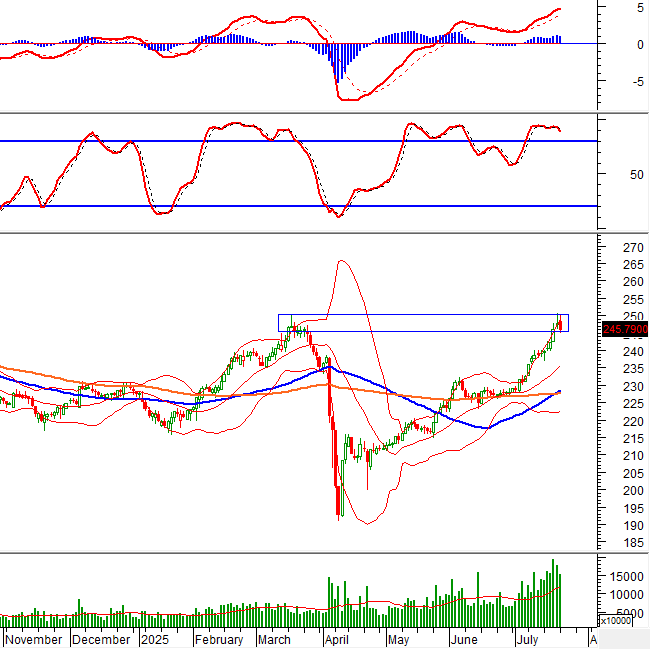
HNX-Index – Re-testing March 2025 Highs
The HNX-Index declined and formed a Bearish Engulfing reversal pattern, indicating an increase in the risk of a downward adjustment.
Currently, the index is re-testing the March 2025 high (corresponding to the 245-250 point range). If selling pressure persists, the previous high breached in February 2025 (corresponding to the 235-240 point range) will serve as the nearest support for the index.
Analysis of Smart Money Flow
Movement of Smart Money Flow: The Negative Volume Index indicator of the VN-Index is currently above the 20-day EMA. If this status is maintained in the next session, the risk of a sudden drop (thrust down) will be limited.
Foreign Capital Flow: Foreign investors returned to net buying in the trading session on July 21, 2025. If foreign investors maintain this stance in the coming sessions, the situation will become more positive.
III. MARKET STATISTICS AS OF JULY 21, 2025
Economic and Market Strategy Analysis Department, Vietstock Consulting
– 17:06 21/07/2025
Market Pulse for July 21: Foreign Investors Turn Net Buyers, VN-Index Hovers Near 1,500 Points

The market closed with the VN-Index down 12.23 points (-0.82%), settling at 1,485.05. The HNX-Index also witnessed a decline of 1.98 points (-0.8%), ending the day at 245.79. The market breadth inclined towards the bears with 435 declining stocks against 331 advancing stocks. Within the VN30 basket, 17 stocks lost ground, 12 advanced, and 1 remained unchanged, reflecting a similar bearish sentiment.
Vietstock Daily: Embracing Challenges, August 1st, 2025

The VN-Index retreated after a volatile session, relinquishing early gains. Despite this pullback, the index remains above the middle Bollinger Band, a critical support level to sustain its upward trajectory. Meanwhile, the Stochastic Oscillator has begun to descend from overbought territory, indicating that the short-term outlook may encounter challenges ahead.
Market Beat: VN-Index Makes a Dramatic U-Turn, Soaring Nearly 9 Points at the Close

The market opened the afternoon session on a shaky note, with the index dropping more than 9 points at one point and flirting with the 1,500-point threshold. However, the latter half of the afternoon painted a different picture, as the index staged a steady recovery, erasing the losses from earlier in the day.
“Market Mayhem: The Wild Ride”

The VN-Index witnessed a volatile session, forming a Doji candlestick pattern, which indicates a tug-of-war between buyers and sellers at higher levels. Trading volume continued to set new records, reflecting the vibrant participation of cash flow. Currently, the Stochastic Oscillator has provided a fresh buy signal, while the MACD is narrowing its gap with the Signal line. If the buy signal is validated in the upcoming sessions, the positive outlook in the short term is likely to prevail.
The Warrant Market on July 22, 2025: A Tale of Diverging Fortunes

The market closed on July 21st, 2025, with a mixed performance; 95 tickers advanced, 96 declined, and 32 remained unchanged. Foreign investors continued net selling, offloading a total of 320,000 covered warrants.


