TradingView’s leading chart technology enhances users’ experience in analyzing financial markets and making informed trading decisions. This technology boasts several standout features:
- User-Friendly Interface: With TradingView integration, users are presented with an intuitive, customizable, and user-friendly interface. Tools and functions are clearly organized, enabling efficient access and usage.
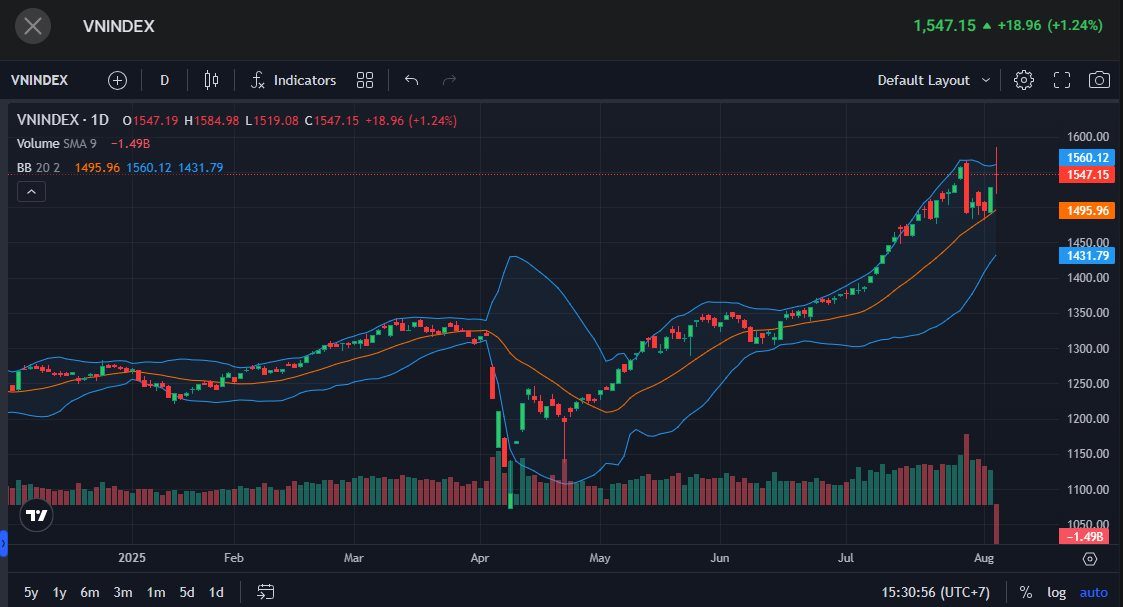
- Powerful Interactive Charts: Through TradingView, CafeF offers charts that allow users to modify time frames, draw support and resistance lines, create Fibonacci retracements, and perform numerous other technical analysis manipulations. This facilitates easy identification of trends and potential buy/sell signals on the VNINDEX chart as well as individual stock charts.
Additionally, CafeF’s collaboration with TradingView provides users with intelligent commodity charts. Stay abreast of trends on the TradingView platform, where gold prices, crude oil, and more come alive with advanced tools.
- Diverse Technical Indicators and Analysis Tools: A wide range of technical indicators are supported, enabling users to analyze trends, assess market strength, and identify potential buy/sell opportunities.
Chart Customization and Storage: CafeF users can customize charts and display settings to their preferences, and efficiently manage multiple charts and templates, saving time and effort in managing analyses and trading strategies.
Key Features of TradingView:
The Economic Calendar in TradingView provides users with insights into upcoming economic events and indicators from various countries. This includes data on GDP, unemployment rates, industrial production growth, PMI (Purchasing Managers’ Index), central bank interest rates, and other economic news. The economic calendar helps users track significant events that may trigger price movements in financial markets, enabling them to make informed trading decisions based on anticipated economic impacts.
TradingView’s Stock Screener grants users access to real-time stock data, a robust stock filtering feature, and in-depth insights through trader-focused tools. We can filter stocks based on parameters such as price, market cap, industry, P/E ratio, ROE, price trends, and many other factors.
With TradingView technology, users can effortlessly perform market analysis and make intelligent trading decisions.
What drives the real estate stocks to soar during the market’s record-breaking trading day?

Despite the bearish stock market with a record-breaking trading volume of nearly 47,000 billion Vietnamese dong, many real estate stocks are still defying the trend and experiencing a strong surge.


