


: Mixed Signals Emerge")

: Short-Term Outlook Continues to Deteriorate")

I. VIETNAMESE STOCK MARKET WEEK 28/07-01/08/2025
Trading: At the end of the 01/08 session, the VN-Index ended the week at 1,495.21, down 0.49% from the previous session. HNX-Index also decreased by 0.53%, falling to 264.93 points. For the whole week, the VN-Index lost a total of 35.92 points (-2.35%), while the HNX-Index still gained 10.37 points (+4.07%).
The Vietnamese stock market returned to a strong adjustment last week. After advancing to a new historical peak at the 1,557-point mark in the first session, the VN-Index suddenly plummeted under heavy profit-taking pressure after a long streak of gains. The index gradually regained balance around the 1,500-point threshold in the remaining sessions with a clear differentiation. At the end of the week, the VN-Index stood at 1,495.21 points, down 2.35% from the previous week.
In terms of impact, CTG exerted the greatest pressure in the last session, taking away nearly 2 points from the VN-Index. This was followed by VIC and BID, which also caused the index to lose a total of 2.4 points. Meanwhile, FPT was the most notable contributor on the opposite side with a 1-point gain.
Most industry groups fluctuated within a narrow range due to differentiated performance. Only the information technology group led the market with an outstanding increase of over 2%, thanks to the outstanding performance of stocks such as FPT (+2.88%), ITD (+4.9%), POT (+6.32%), HIG (+3.7%), and HPT hitting the ceiling price.
This was followed by the energy and healthcare groups, with the main contributions coming from BSR (+1.47), OIL (+1.64%), PVT (+1.39%), VTO (+2.41%), VIP (+1.5%), MVB (+4.42%); IMP (+1.35%), DHT (+1.16%), DVN (+1.33%), FIT (+4%), PBC (+2.99%), and JVC (+1.67%).
Meanwhile, the two industry groups with the largest market capitalization, finance and real estate, were at the bottom with a decrease of 0.66% and 0.39%, respectively. They were largely influenced by the adjustment of BID (-1.72%), CTG (-3.49%), STB (-1.1%), SSI (-2.92%); VIC (-1.42%), BCM (-2.51%), PDR (-2.42%), TCH (-3.97%), and NLG (-3.13%). However, the overall picture was not too negative as bright spots remained, such as NVB hitting the ceiling price, HDB (+2.08%), SHB (+1.16%), BVH (+1.52%), VCI (+3.25%); NVL (+3.6%), VPI (+2.12%), HDC (+2.29%), VCR (+2.91%), VRE (+1.25%), along with SJS and TAL reaching the maximum daily percentage change allowed by the exchange.
Foreign investors net sold VND 4.7 trillion on both exchanges last week. Of which, foreign investors net sold VND 4.8 trillion on the HOSE exchange but still net bought over VND 54 billion on the HNX exchange.
Trading value of foreign investors on HOSE, HNX, and UPCOM by date. Unit: VND billion
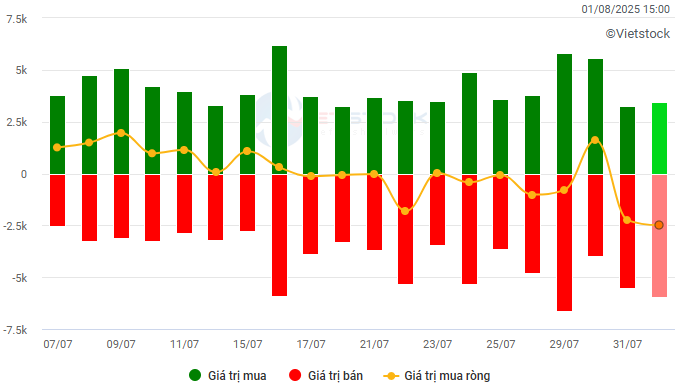
Net trading value by stock ticker. Unit: VND billion

Stocks that increased significantly last week were NAF
NAF increased by 23.06%: NAF recorded a vibrant trading week with all 5 sessions gaining points, along with active trading volume. The share price surpassed the upper band of the Bollinger Bands and formed a Three White Soldiers candlestick pattern, reflecting the very optimistic sentiment of investors.
Currently, the MACD and Stochastic Oscillator indicators continue to point upwards after issuing buy signals, indicating that the positive short-term outlook for the stock will continue.
Stocks that decreased significantly last week were VTP
VTP decreased by 10.29%: VTP is trading weakly after its share price fell below the Middle line of the Bollinger Bands.
Currently, the stock is retreating to retest the old bottom of May 2025 (equivalent to the 106,000-111,000 range) while the MACD indicator continues to point downwards after giving a sell signal, even falling below the zero threshold. The short-term outlook for the stock will become even more pessimistic if it fails to hold this price range in the coming sessions.
II. STOCK MARKET STATISTICS FOR LAST WEEK


Economic & Market Strategy Division, Vietstock Research Team
The Market Beat: Foreigners Turn Net Buyers, VN-Index Recovers Over 14 Points

The trading session concluded with significant gains, as the VN-Index rose by 14.22 points (+0.95%), closing at 1,507.63. Meanwhile, the HNX-Index also witnessed a notable increase of 6.15 points (+2.41%), finishing the day at 261.51. The market breadth tilted in favor of advancers, with 426 tickers in the green and 337 in the red. Similarly, the VN30 basket painted a bullish picture, as 20 stocks advanced, 9 declined, and 1 remained unchanged, ending the day on a positive note.
Stock Market Insights: Can the Uptrend Persist?

The VN-Index showcases a near-Doji candle pattern, with liquidity maintained above the 20-session average, indicating investor indecision. In the short term, the index is likely to retest the historical peak around the 1,530-point level. However, investors should be cautious of potential volatility at higher price levels, as the Stochastic Oscillator indicator weakens in the overbought territory.
Market Beat: Foreigners Turn Net Buyers, VN-Index Holds Firm at 1,510 Points

The trading session concluded with the VN-Index climbing 2.77 points (+0.18%), reaching 1,512.31. Meanwhile, the HNX-Index witnessed a rise of 1.48 points (+0.6%), ending the day at 249.33. The market breadth tilted towards the bulls, as evident from the advance-decline ratio of 467:296. A similar trend was observed in the VN30 basket, with 17 gainers outpacing 13 losers.
The Market Breakthrough

The VN-Index soared to new heights, surpassing its previous record peak set in early 2022. Impressive liquidity has been sustained, with average volumes over the past 20 weeks reflecting a strong influx of capital into the market. The MACD indicator continues to widen the gap with the Signal line since the buy signal emerged in mid-May 2025, reinforcing the upward momentum in the medium term. However, the Stochastic Oscillator has begun to level off in the overbought region, suggesting a potential for technical corrections at elevated price levels in the coming weeks.
Vietstock Weekly 21-25 July 2025: Marching Towards Historic Highs

The VN-Index rallied for the fifth consecutive week, eyeing the historic peak reached in early 2022 (1,500-1,530 points). Last week’s trading volume hit a record high, indicating vigorous market participation. The MACD indicator continues to widen the gap with the signal line after giving a bullish signal in mid-May 2025, reinforcing the intermediate uptrend. Nonetheless, investors should be cautious of potential short-term fluctuations as the Stochastic Oscillator ventures deeper into overbought territory.


