


: Mixed Signals Emerge")

: Short-Term Outlook Continues to Deteriorate")

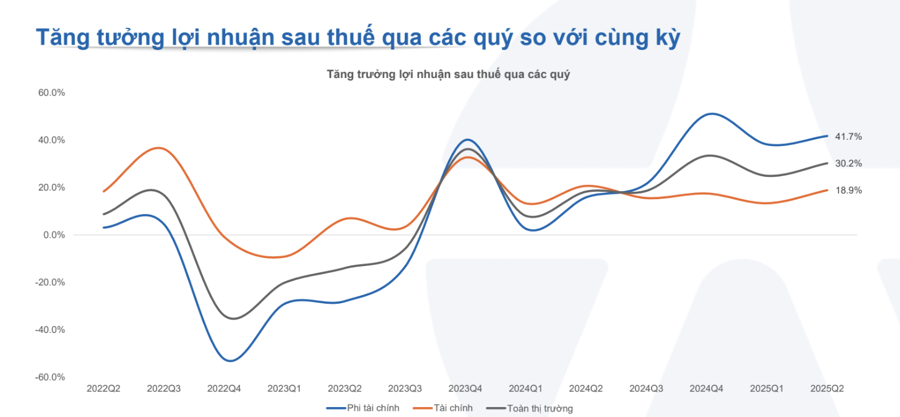
As of August 4, 2025, 1,064 listed companies, representing 98.7% of the total market capitalization, have published their financial statements or preliminary estimates of their business results for Q2 2025, with after-tax profits maintaining a growth rate of 30.2% over the same period in 2024.
The Non-Financial group continued to lead growth for the fourth consecutive quarter, with a 41.7% increase in Q2 2025. Notably, the Export and Industrial Real Estate groups, directly impacted by tariffs, maintained profit growth of 153.6% and 63%, respectively.
In the Public Investment group, the Construction and Materials sector improved due to accelerated public investment in Q2 2025, resulting in a 25.5% increase in after-tax profits.
The Financial group witnessed robust growth in the Financial Services sector, driven by enhanced liquidity in the stock market during Q2 2025. Conversely, the Banking group recorded a modest 17.5% growth in after-tax profits compared to the overall market, as commercial banks maintained low-interest rates.
Commenting on the Q2 business results and their reflection on stock prices, Mr. Tran Hoang Son, Market Strategy Director of VPBank Securities Joint Stock Company (VPBankS), stated that with over half of the companies having released their reports, the profit picture for this year looks very promising.
The profit outlook is positive for both the financial and non-financial sectors. The financial sector accounts for a significant proportion of market capitalization and liquidity. With profit growth reaching 18% in the second quarter compared to the previous year, the market has discovered several financial stocks with impressive profit growth, thereby uncovering investment opportunities for the next phase.
According to statistics, stocks with robust profits in Q2 and the first six months of the year have also experienced significant price appreciation. For instance, CTG recorded a 46.5% profit growth in the first half of the year, and its stock price rose by 23.4% in three months and 43.4% in one year.
MBB stock has climbed by nearly 17% in three months and 29.4% in one year, alongside an 18% profit growth in the first half. VPB has witnessed a remarkable surge, rising over 39% in one month and 60% in three months. This substantial price increase for VPB is largely attributed to its impressive Q2 profit growth of 35.6% and a six-month growth of over 30%.
It’s evident that strong business performance translates to positive stock price momentum, as profits are the primary driver of mid to long-term price trends. The longevity of this upward price movement depends on the company’s financial results and intrinsic value.
Beyond the banking sector, real estate stocks like VHM and VIC have led the growth indices. Securities stocks, including VIX, MBS, and SHS, are also on an upward trajectory, bolstered by their robust financial performance.
Mr. Son further elaborated that if the positive business performance continues in the last six months of the year, the adjustment of many stocks to reasonable support levels could present investment opportunities during this period. However, there are also cases where stock prices surge despite stagnant business results. In such scenarios, the price movement is superficial, and the underlying reasons for the price increase are more crucial.
If the price surge is not rooted in fundamental factors, it is unlikely to be sustained. Mr. Son also noted that there would always be stocks with outstanding Q2 or six-month performance, yet their prices remain stagnant or decline. These stocks typically belong to the mid-to-small capitalization segment, which often goes unnoticed.
Even with exceptionally high profit growth rates, the absolute figures might only amount to a few billion VND. Therefore, when profit growth reaches several hundred or thousand percent, it is essential to consider the low base from the previous year.
A second reason could be that these stocks have already reflected their profits in the previous period. An example is CTR, which achieved a 15.9% profit growth in Q2 and 10.5% in the first six months. However, CTR’s price has already surged significantly in the past two years, indicating that the current price is fair relative to its earnings.
The PEG ratio is a valuable indicator for investors, revealing whether the current stock price adequately reflects the business performance. The P/E ratio informs investors about the price-to-earnings multiple, indicating whether a stock is expensive or affordable. In CTR’s case, with a P/E ratio ranging from 14 to 18, and a six-month profit growth of just over 10%, the PEG ratio is higher than 1. This suggests that the profit growth rate is not commensurate with the price increase. In other words, the current price already incorporates the growth factor, and when the PEG is higher than 1, the market no longer considers the stock an attractive investment prospect.


