


: Mixed Signals Emerge")

: Short-Term Outlook Continues to Deteriorate")

I. MARKET ANALYSIS OF SECURITIES ON AUGUST 06, 2025
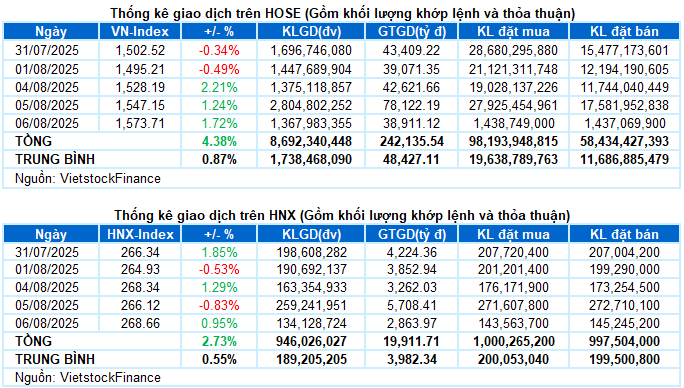
– The main indices rose in the trading session on August 6. Specifically, VN-Index increased by 1.72%, reaching 1,573.71 points. HNX-Index also rose by 0.95% to 268.66 points.
– The matching volume on the HOSE floor decreased sharply by 50.8% compared to the previous session’s high surge, reaching 1.3 billion units. Similarly, HNX recorded 131 million units, a decrease of 49.2%.
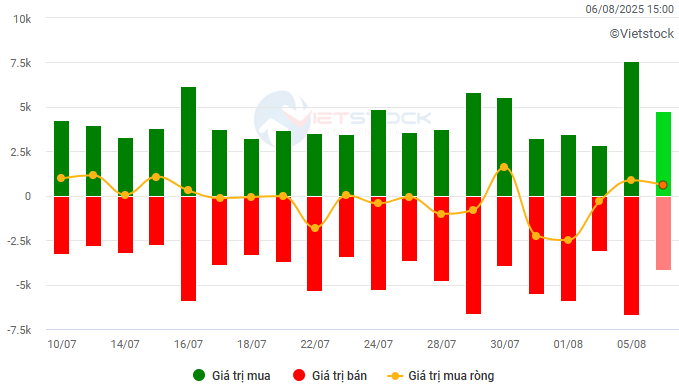
– Foreign investors continued to net buy with a value of more than VND 368 billion on the HOSE and VND 214 billion on the HNX.
Trading value of foreign investors on HOSE, HNX and UPCOM by day. Unit: Billion VND
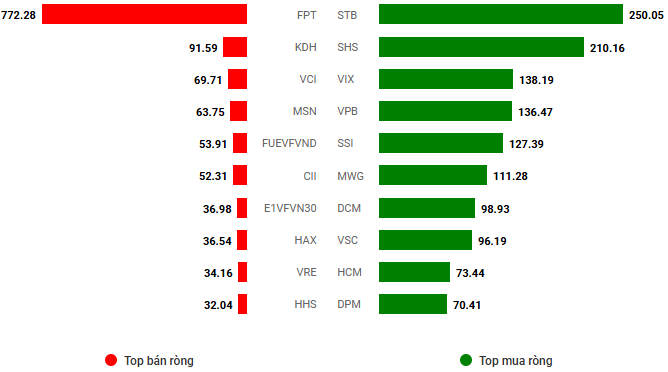
Net trading value by stock code. Unit: Billion VND
– The market continued to perform well in the trading session on August 6, 2025. Despite the strong fluctuations in the previous session that made investors more cautious, the VN-Index still started with positive green signals. After the shaking rhythms around the threshold of 1,555 points in the first half of the morning session, the upward momentum was gradually consolidated thanks to the solid pull from the pillar group. The enthusiastic psychology increasingly spread, helping the index to break through strongly before the lunch break. In the afternoon session, the index showed signs of slowing down when approaching the threshold of 1,570 points. However, active buying demand still dominated and helped VN-Index close at the highest level of the day, reaching 1,573.71 points, up 1.72% compared to the previous session.
– In terms of impact, TCB was the most positive contributor, bringing 2 points to the VN-Index. Following were VCB and VHM, which also contributed a total of nearly 3 points. Meanwhile, the total impact of the 10 stocks with the most negative influence only took away about 1 point from the index, indicating the dominance of the buying side.
– VN30-Index continued to break impressively with nearly 33 points, reaching 1,723.31 points. The breadth was heavily biased towards buying with 28 stocks rising and only 2 falling. On the rise, STB and MWG stood out with outstanding gains of 4.6% and 4.5%, respectively. In addition, TPB, ACB, TCB, and MBB also attracted positive buying pressure, all rising by more than 3%. Meanwhile, the only two names dominated by red signals in the basket were VRE and FPT, down 2.7% and 0.9%, respectively.
Positive green signals covered most industry groups. Energy led the gains with the main driving force coming from BSR, which hit the ceiling price, PLX (+2.32%), OIL (+3.31%), PVS (+3.28%), PVD (+2.63%), PVT (+1.94%), PVB (+2.02%), and PVC (+5%).
The media and financial services groups were also competitive, with notable buying pressure in a series of names such as VGI (+5.21%), CTR (+1.43%), MFS (+5.43%), TTN (+2.82%); VIX (+6.34%), TCB (+3.24%), SHS (+4.31%), MBB (+3.03%), TPB (+3.41%), STB (+4.64%), HCM (+4.71%), and EVF hitting the ceiling price.
In contrast, information technology was the only group that went against the general trend, falling by 0.75%. This was influenced by pressure from stocks such as FPT (-0.85%), DLG (-1.5%), HIG (-5%), and HPT falling to the floor price.
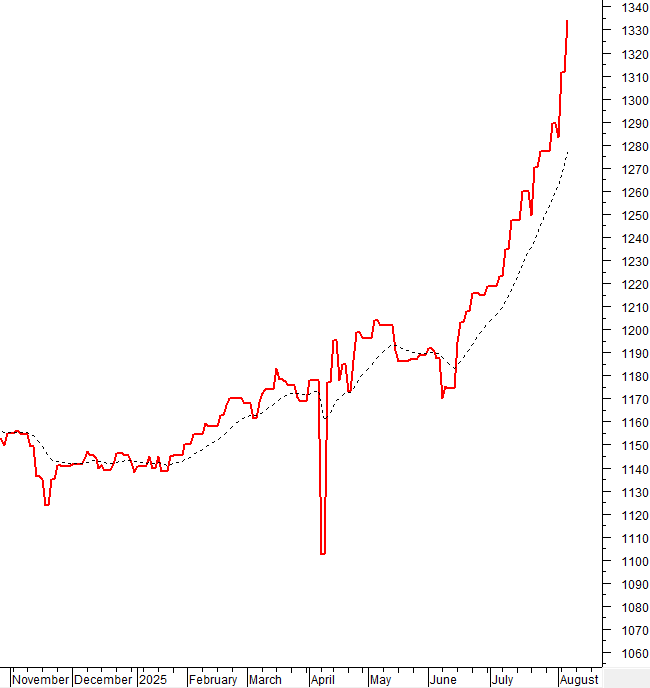
VN-Index increased for the third consecutive session and closely followed the Upper Band of Bollinger Bands, thereby setting a new historical peak. The MACD indicator has given a buy signal again when it cuts up the Signal line, while the Stochastic Oscillator continues to rise after the previous buy signal. If these signals continue to be reinforced in the coming sessions, the positive momentum in the short term is likely to continue.
II. TREND AND PRICE MOVEMENT ANALYSIS
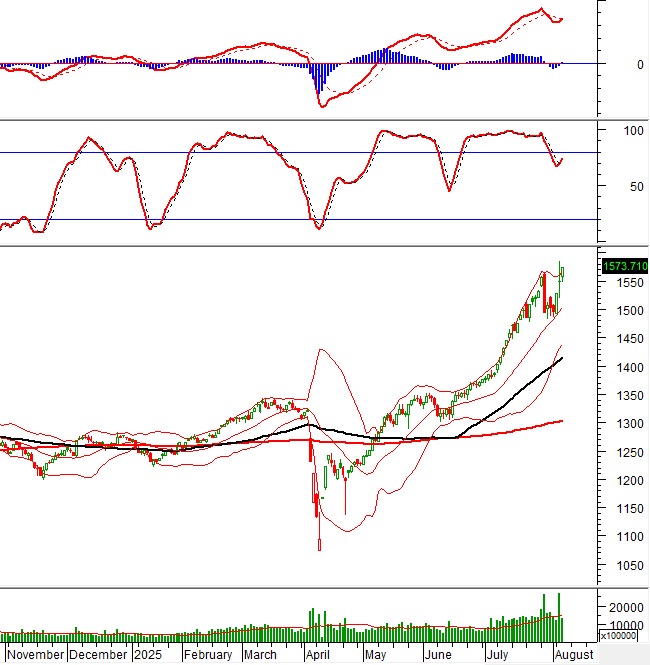
VN-Index – MACD indicator cuts up the Signal line
VN-Index increased for the third consecutive session and closely followed the Upper Band of Bollinger Bands, thereby setting a new historical peak.
Currently, the MACD indicator has given a buy signal again when it cuts up the Signal line, while the Stochastic Oscillator continues to rise after the previous buy signal. If these signals continue to be reinforced in the coming sessions, the positive momentum in the short term is likely to continue.
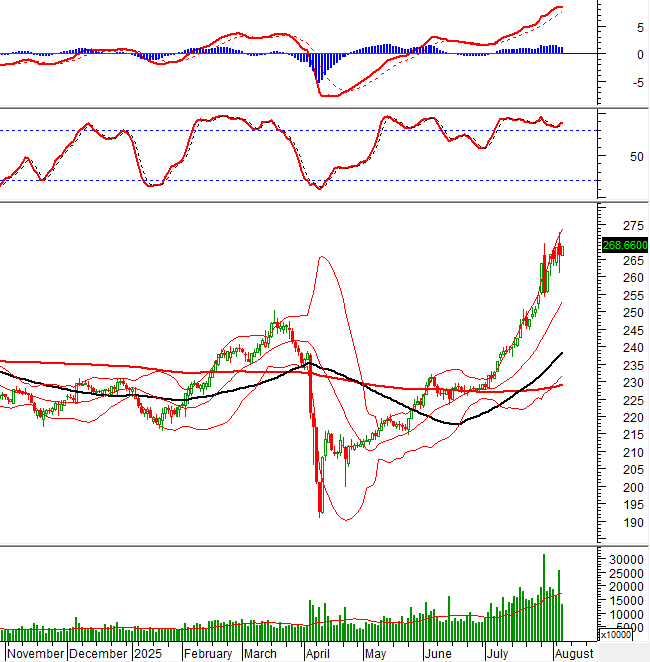
HNX-Index – Trading volume fluctuates strongly
HNX-Index increased and continued to accumulate in the range of 265-270 points. However, trading volume has fluctuated quite strongly in recent sessions, which is a notable factor.
Currently, the Stochastic Oscillator and MACD indicators continue to rise and reinforce the buy signal, indicating that the short-term uptrend is still supported.
Analysis of Capital Flows
Fluctuations in smart money flow: The Negative Volume Index indicator of VN-Index is currently above the EMA 20 days. If this status continues in the next session, the risk of unexpected declines (thrust down) will be limited.
Fluctuations in foreign capital flow: Foreign investors continued to net buy in the trading session on August 6, 2025. If foreign investors maintain this action in the coming sessions, the situation will become even more optimistic.
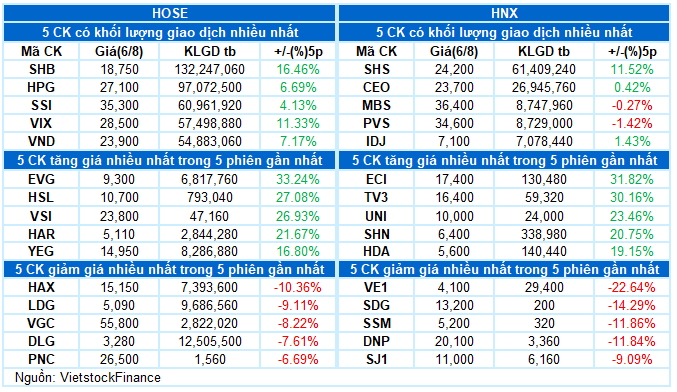
III. MARKET STATISTICS ON AUGUST 06, 2025
Economic Analysis and Market Strategy Department, Vietstock Consulting
– 17:18 08/06/2025
The Stock Market Frenzy: Investors Rush to Open Accounts as VN-Index Soars to New Heights

The number of new securities accounts opened in July hit an 11-month high, marking a significant surge in investor activity.
The Self-Business Securities Companies Unexpectedly “Dumped” Over VND 1.4 Trillion in the Session VN-Index “Rollercoaster Ride”

The HoSE-listed securities firms continued their net selling streak, offloading stocks worth VND1,417 billion.
Is Now a Good Time to Invest in Stocks?

“The VN-Index has reached an all-time high, and many new investors (F0) with limited funds of between 10 and 20 million dong are wondering if now is the right time to enter the stock market. “
The VN-Index Surges with Record Liquidity: Is This the Start of a New Bull Market or Just a Fleeting Euphoria?

“The market has been on an upward trajectory for over a month now, and a correction is necessary to facilitate accumulation and build a foundation for conquering new peaks,” predicted the expert from Pinetree.
The Vietnamese Stock Market: Navigating Unprecedented Volatility

The market transactions are buzzing and breaking records with unprecedented liquidity.


