


: Mixed Signals Emerge")

: Short-Term Outlook Continues to Deteriorate")
XRP: Short-Term Consolidation
On the weekly chart, after breaking above the upper edge of the Descending Triangle pattern, the price is consolidating at the January 2025 high region (equivalent to the $3-3.40 region).
Additionally, the price is hugging the Upper Band of the Bollinger Band, while the MACD indicator continues to point upward after providing a buy signal, indicating that the mid-term uptrend remains intact.
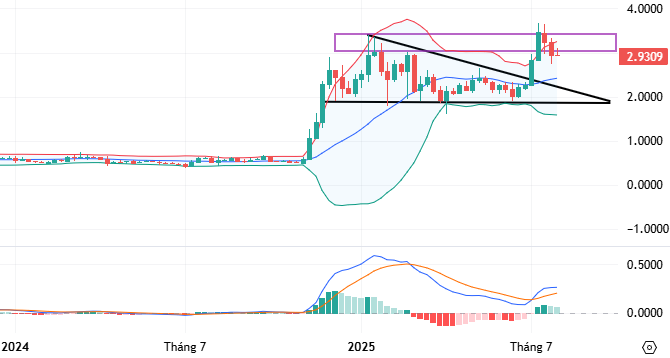
XRP chart for 2024 – 2025 – Source: TradingView
Switching to the daily chart, the XRP price successfully retested the 50-day SMA amid a narrowing gap between the MACD and the Signal line. A renewed buy signal from this indicator would bolster the bullish outlook.
Furthermore, the golden cross between the 50-day SMA and the 200-day SMA, which occurred in July 2025, adds weight to the argument for continued upside momentum.
Given these technical factors, I anticipate that XRP will continue to consolidate at the aforementioned January 2025 high region ($3-3.40). However, should the price decisively surpass this zone, the uptrend is likely to gain more solid footing, with the next potential price target being the Fibonacci Projection level of 78.6% ($3.80-$3.90).
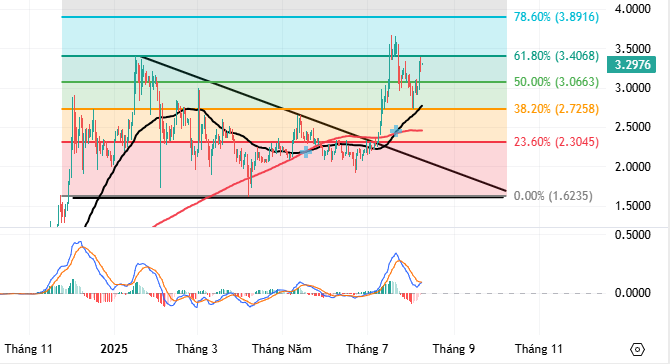
XRP chart for 2024 – 2025 – Source: TradingView
SOL: Consolidation Persists
On the weekly chart, SOL began to show signs of weakness as it approached the March 2024 high region (roughly $190-$210) and has been oscillating around the Middle Band of the Bollinger Bands.
Moreover, the ADX indicator remains below the 20 level, suggesting that the mid-term trend is relatively weak, and that the sideways price action with interspersed bullish and bearish sessions is likely to persist.
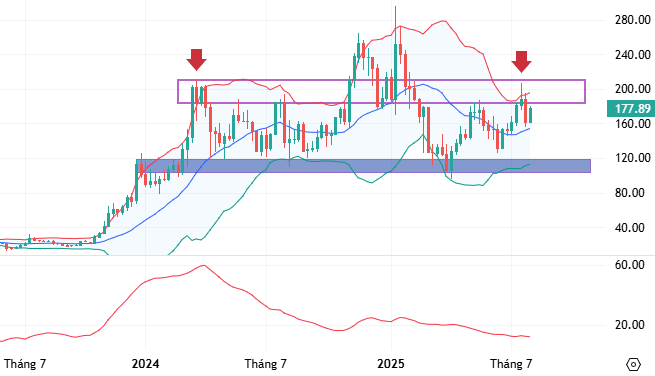
SOL chart for 2024 – 2025 – Source: TradingView
On the daily chart, following a pullback from the upper edge of the Rising Wedge pattern, the price is retesting the cluster of the 50-day SMA and the 200-day SMA.
The Stochastic Oscillator has provided a buy signal in the oversold region, indicating that the downside risk has diminished considerably.
In conclusion, based on these technical factors, I believe that SOL is undergoing a short-term corrective phase. Traders should refrain from initiating new positions in this region and instead await more conclusive technical cues.
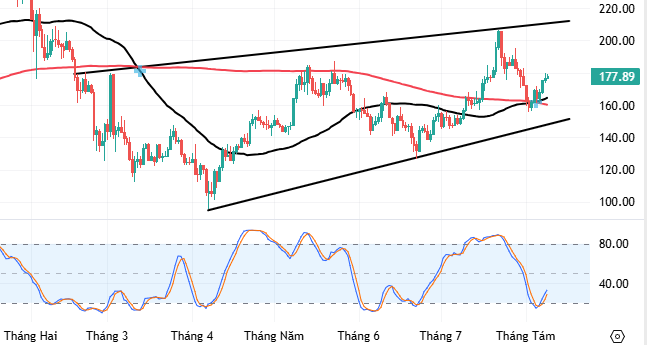
SOL chart for 2025 – Source: TradingView
Technical Analysis Team, Advisory Department, Vietstock
– 10:07 11/08/2025
The Mastermind Behind the $100 Million Crypto Scam: Unraveling the Web of Deceit

A sophisticated group led by Thoai has scammed thousands of people in a sophisticated crypto scheme. The group developed a stablecoin (USDT) on the BO crypto exchange platform “Toptrade1” and orchestrated a massive 2,600 billion VND ($109 million) fraud.
17 Million Vietnamese Hold Digital Assets: How Many Crypto Exchanges Will Be Piloted Soon?

The Ministry of Finance is currently refining a draft decree on piloting a digital asset exchange.
The Next Crypto Revolution: 17 Million Vietnamese Embrace Digital Assets – How Many Trading Platforms Will Emerge to Meet the Demand?

The Ministry of Finance is currently refining a draft decree on piloting a digital asset exchange.
The Crypto Conundrum: Unraveling the Future of Digital Asset Exchanges

The Ministry of Finance is finalizing a pilot project for the crypto asset market. This development comes after a thorough examination of international experiences and domestic realities. The proposal is currently under review by the government, which will then be reported to the Politburo for approval to proceed with a pilot, complete with a transparent roadmap and clear criteria.
The Top Stocks to Watch at the Start of Today’s Session

The stock market is a dynamic and ever-changing landscape, and keeping track of the biggest movers is crucial for investors. Vietstock’s statistical insights offer a glimpse into the stocks that have been making waves, showcasing the biggest gainers and losers in recent sessions. This data is a valuable tool for investors looking to make informed decisions and navigate the market’s twists and turns.


