


: Mixed Signals Emerge")

: Short-Term Outlook Continues to Deteriorate")
Vietnam’s Stock Market Hits New Highs: Key Considerations for Investors to Navigate Potential Pitfalls
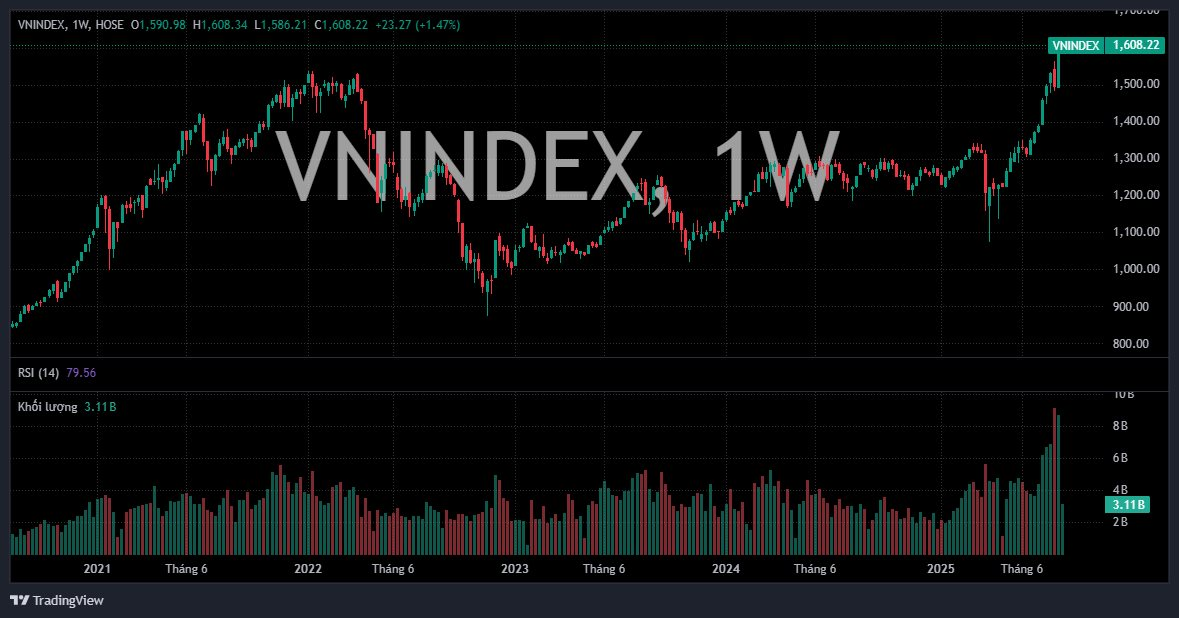
Vietnam’s stock market witnessed a dramatic session on August 12th, as the VN-Index briefly wiped out all its gains for the day. However, late efforts pushed the benchmark index back into positive territory, closing 11.36 points higher at 1,608.22, officially surpassing its historical peak. This rally was accompanied by robust trading activity, with HoSE’s matching value reaching an impressive 43,760 billion VND.
Mr. Tran Hoang Son, Market Strategy Director at VPBank Securities (VPBankS), shared insights during the program “Vietnam and the Indices: Financial Prosperity.” According to Mr. Son, the market has been riding a strong wave since its April lows, but there are some key considerations to keep in mind.
Looking back at the bull market from 2016 to 2018, there were five distinct periods of strong gains, ranging from 20% to 30% each time. Following these surges, the market typically experienced periods of consolidation, lasting two weeks or more, with average corrections of around 10%.
Moving into 2020–2022, there were approximately four significant rallies from the lows, each stronger than the previous one, with average gains ranging from 37% to 52%. After these waves, the market usually underwent adjustments of 13% to 16%.
Investors can study these historical patterns to anticipate potential buying opportunities during market corrections and identify profitable exits during upward trends. Just over a week ago, the market experienced a sharp decline of 60–70 points, with many popular stocks falling to their daily lower limits and facing selling pressure at the end of the session. “Recent signals indicate that we are approaching a period of adjustment,” the expert pointed out. “Unlike the rapid corrections seen last week, this adjustment is likely to unfold over one to two weeks.”
Since April, the market has experienced two distinct waves. The first wave took the index from its April lows to 1,350 points, representing a gain of 25.48%. The second wave propelled the index from 1,310 points to the 1,600 level, a rise of nearly 23%. Combined with the fact that the market has rallied over 50% since April, these milestones, along with the psychological resistance level of 1,600, are crucial factors for investors to consider.
Mr. Son highlighted two critical round-number levels: 1,600 and 1,650. Notably, the 1,650 level also aligns with the extended trend line connecting the peaks from 2022 to 2023. Investors should be mindful of these levels to avoid unexpected corrections in the upcoming rally.
In terms of valuation, the Relative Strength Index (RSI) has breached the 70 level and reached as high as 78 during the previous rally. Investors can also monitor the RSI of the VN-Index basket (comprising all stocks in the VN-Index). When the RSI of this basket approaches the 20–30% range, the market often experiences heightened volatility and corrections. During the recent 60–70 point decline, the RSI of the VN-Index basket climbed close to the 40% threshold, indicating that 40% of the stocks in the VN-Index basket had RSI values at or above 70.
Historical data shows that when the RSI of the VN-Index basket surpasses the 30–40% range, the market has experienced notable corrections, as witnessed in 2020, 2022, and most recently in 2023 and 2024. This serves as a clear warning signal.
Additionally, investors should pay attention to the distance between the VN-Index and its 50-day moving average (MA50) . Statistical analysis reveals that as this distance widens, the likelihood of a market correction increases. Data from the bull market of 2017 to the present indicates that when the VN-Index trades at 1.06 to 1.14 times its MA50, a correction is typically imminent.
In a heated market, the gap between the VN-Index and its MA50 tends to expand, signaling that the market is overextended. When this overextension occurs, a corrective phase usually follows to smoothen the price trajectory. Currently, the VN-Index is trading at approximately 1.11 times its MA50, serving as a short-term indicator for investors to consider. Mr. Son advised: “We are entering a period of rapid gains, and investors should refrain from impulsive decisions, waiting instead for more definitive signals.”
In terms of valuation , after a 50% rally from its lows, the VN-Index’s P/E and P/B ratios have returned to levels close to the 10-year average. The index has transitioned from being undervalued to becoming more fairly valued. When the market reaches fair valuation, it often pauses or consolidates.
How Long Do Correction Phases Typically Last?
According to Mr. Tran Hoang Son, when the market experiences substantial gains or losses, it tends to overshoot, resulting in sharp reversals. Even professional investors cannot accurately predict the exact peak of the VN-Index due to this tendency for overextension. Corrections occur when there is a significant overshoot, reflected in the RSI rising above 70 or 80. Additionally, a rapid ascent from previous lows or a substantial surge compared to the average wave can also indicate overextension.
At present, the most evident signal for investors to monitor is liquidity. In the recent rally, liquidity reached record levels, with an average matching value of 56,000 billion VND and certain sessions surpassing 80,000 billion VND. These figures indicate an exceptionally high level of market participation.
For a noticeable correction to occur, liquidity accumulation typically lasts for two to three weeks or even longer. During this accumulation phase, distribution sessions emerge, characterized by high liquidity and abrupt reversals from upward trends.
If these signs persist over an extended period, coupled with a peak in liquidity followed by a gradual decline, it may suggest that market participants are becoming more cautious. “This scenario is akin to a snowball gaining momentum as it rolls downhill,” Mr. Son explained. “Once it accumulates sufficient energy, mass, and velocity, a triggering event can set off a swift corrective phase.”
Looking back at the COVID-induced market turmoil, similar sessions unfolded. The VN-30 witnessed a sell-off, with almost all constituents hitting their daily lower limits simultaneously. However, this trend lasted only about one and a half to two sessions, after which the market swiftly recovered.
New investors often lack the experience to recognize these patterns and tend to ride the waves enthusiastically, ignoring warning signals. As a result, they may buy at elevated levels and, due to disciplined stop-loss strategies, end up selling at the bottom when a sudden correction occurs.
The Stock Market Conundrum: Assessing the Valuation of Securities as VN-Index Hits 1,600 Points

Amid the stock market’s exuberance, market participants are left wondering whether securities firm stocks, which typically move in tandem with the broader market, remain attractively priced.
The Foreign Sell-Off Continues: Over $30 Million in Net Selling as Banks See Buying Spree

The foreign investors’ sell-off trend continued in the Vietnamese market, with FPT stock witnessing the largest net sell-off, totaling an enormous VND 1.71 trillion.
Market Beat: VN-Index Hangs on at 1,611 Points, Foreigners Sell FPT en Masse.

The market closed with positive gains, as the VN-Index rose by 3.38 points (+0.21%), reaching 1,611.6. Similarly, the HNX-Index climbed 3.22 points (+1.16%) to 279.69. The market breadth tilted towards the bulls, with 397 advancing stocks against 387 declining ones. However, the large-cap VN30 index painted a different picture, with 16 stocks in the red, 11 in the green, and 3 unchanged.
Market Mayhem: Navigating the Storm

The VN-Index experienced vigorous tug-of-war action with above-average trading volume. The MACD indicator continues its upward trajectory, providing a buy signal and reinforcing the positive short-term outlook. However, intense fluctuations within the session are likely to persist as the index forges new peaks.
“Technical Analysis for August 13: Proceeding With Caution”

The VN-Index and HNX-Index both witnessed a decline during the morning session, with an increase in trading volume. This indicates a cautious sentiment among investors, who are carefully navigating the market and assessing their investment strategies.


