


Understanding the basic candlestick patterns is the first step for investors to seize opportunities and effectively manage risks. This article will introduce common candlestick patterns, their meanings, and how to apply them in stock investing.
Anatomy of a Japanese Candlestick
A Japanese candlestick represents a stock’s price movement over a specific time frame (minutes, hours, days, weeks, etc.). Its structure includes:
Body: The rectangular portion indicates the distance between the opening (open) and closing (close) prices. If the closing price is higher than the opening price, the candlestick is green, indicating a bullish trend. Conversely, if the closing price is lower, the candlestick is red, signaling a bearish trend.
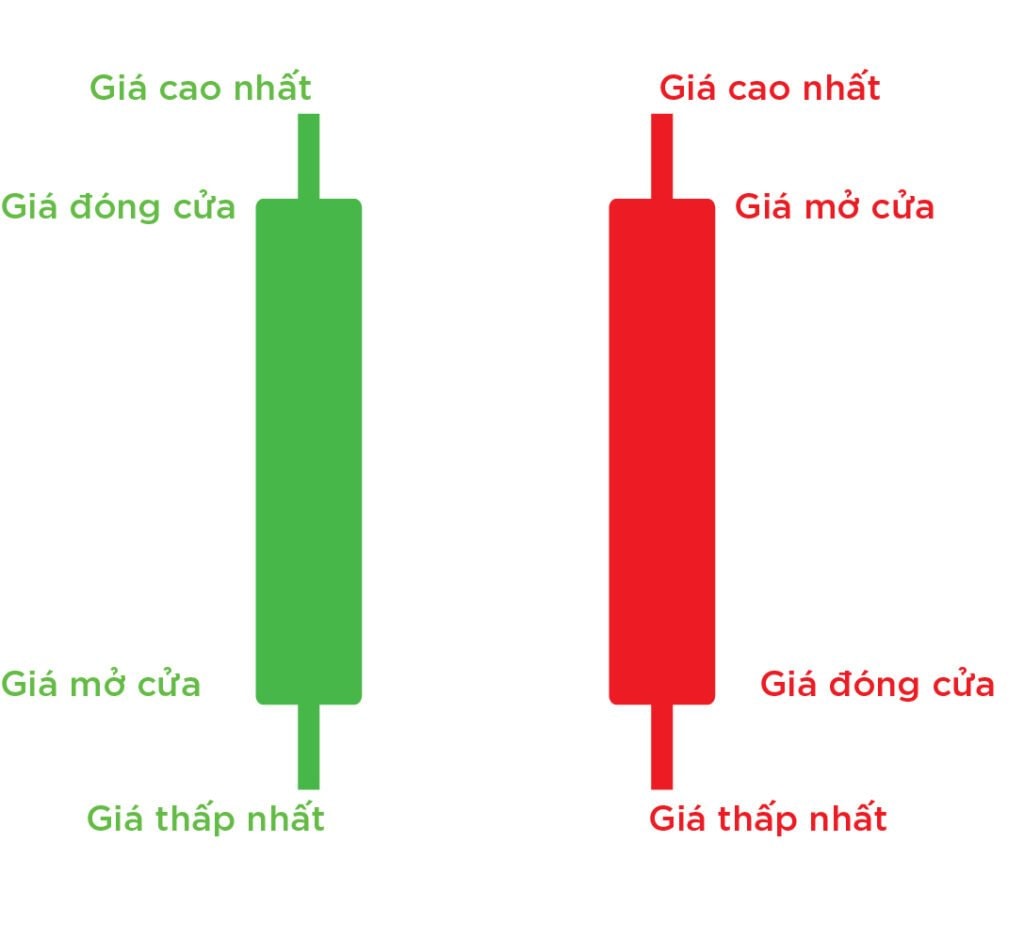
Japanese Candlestick with a green body indicating a bullish trend
Shadows: The thin lines extending from the body represent the price fluctuations. The upper shadow connects from the top of the body to the highest price (high), while the lower shadow extends from the bottom of the body to the lowest price (low).
Significance: A long body indicates a strong trend, whereas long shadows suggest volatility or buying/selling pressure.
Doji: Market Equilibrium Signal
A Doji candlestick occurs when the opening and closing prices are nearly equal, resulting in a very small body or a horizontal line. This pattern signifies market indecision, where buying and selling forces are balanced. There are three main types of Doji:
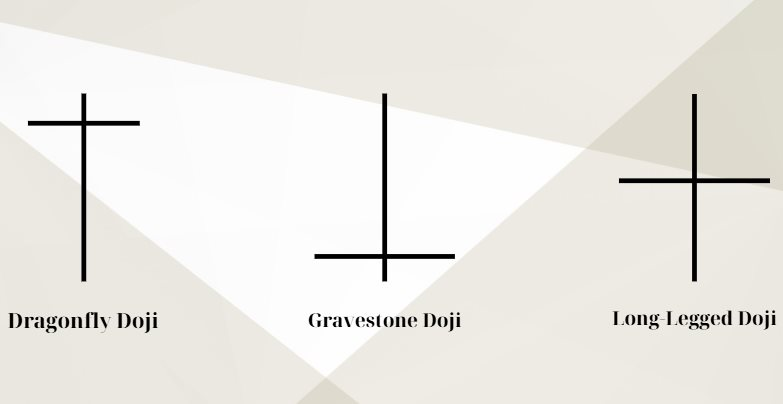
The three variations of Doji: Dragonfly, Gravestone, and Long-Legged
Dragonfly Doji: The opening, closing, and high prices are nearly equal, but the low price is significantly lower. This pattern often appears at the bottom of a downtrend and signals a potential reversal to an uptrend.
Gravestone Doji: Conversely, the opening, closing, and low prices are nearly equal, while the high price is much higher. This pattern indicates a potential downtrend reversal and is typically seen at the top of an uptrend.
Long-Legged Doji: Featuring long upper and lower shadows, this pattern signifies high volatility without a clear trend.
Application: Doji patterns are often used to confirm turning points when combined with other technical indicators such as the RSI or trend lines.
Marubozu: Power of the Trend
Marubozu candlesticks have long bodies and negligible or no shadows, reflecting the dominance of either buying or selling pressure. There are two types of Marubozu:
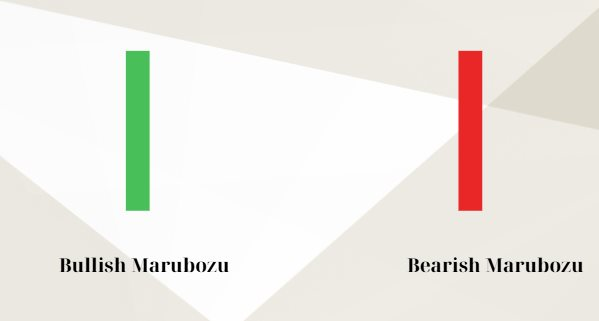
Bullish and Bearish Marubozu patterns showcasing the power of the trend
Bullish Marubozu: The opening price is the lowest, and the closing price is the highest, indicating strong buying pressure. This pattern suggests a continuation of the uptrend.
Bearish Marubozu: Conversely, the opening price is the highest, and the closing price is the lowest, signaling a strong downtrend.
Application: Marubozu patterns often emerge in strong trends, helping investors identify opportunities to enter or exit the market.
Hammer and Hanging Man
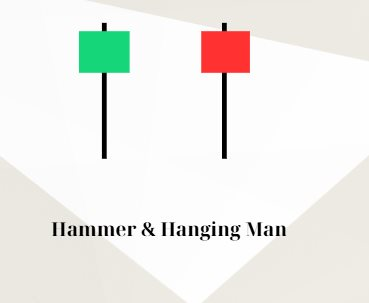
Hammer and Hanging Man patterns with similar structures but opposite implications
Hammer: This pattern has a small body, a long lower shadow (twice to three times the body length), and a very short or non-existent upper shadow. It appears at the end of a downtrend and signals a potential reversal to an uptrend.
Hanging Man: Similar to Hammer but appears at the peak of an uptrend, forewarning a potential downtrend.
Application: These patterns require confirmation from the subsequent candlestick or other indicators to ensure reliability. For instance, a strong upward candlestick following a Hammer pattern reinforces the reversal signal.
Morning Star and Evening Star
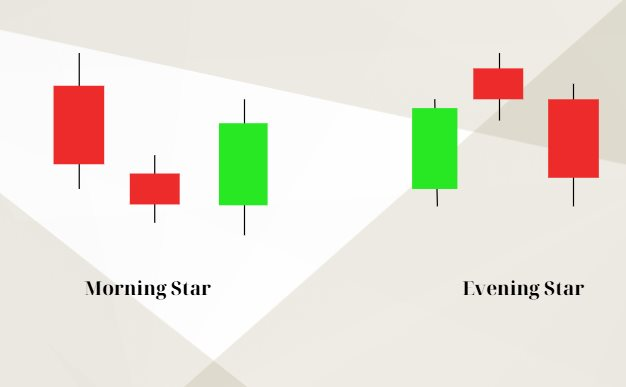
Morning Star and Evening Star patterns: shining light on trend reversals
Morning Star: This three-candlestick pattern appears at the bottom of a downtrend, consisting of a strong downward candlestick, a small-bodied candlestick (possibly a Doji), and a strong upward candlestick. It signals a powerful reversal to an uptrend.
Evening Star: Conversely, this pattern appears at the peak of an uptrend, comprising a strong upward candlestick, a small-bodied candlestick, and a strong downward candlestick, indicating a shift to a downtrend.
Application: These patterns are highly effective when combined with trading volume to confirm the strength of the trend reversal.
Engulfing Pattern
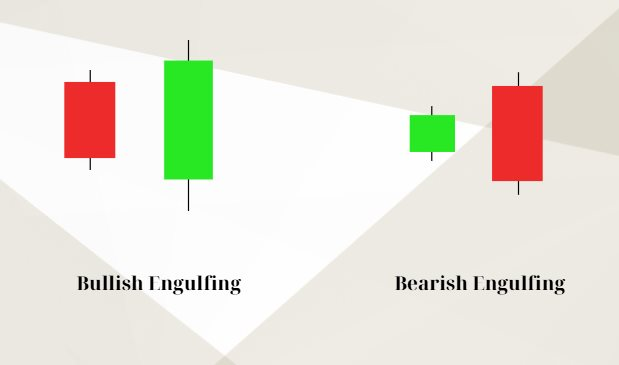
Bullish and Bearish Engulfing patterns: engulfing the previous trend
Bullish Engulfing: A strong upward candlestick completely engulfs the previous downward candlestick, appearing at the bottom of a downtrend and signaling a reversal to an uptrend.
Bearish Engulfing: A strong downward candlestick engulfs the previous upward candlestick, emerging at the peak of an uptrend and indicating a shift to a downtrend.
Application: The Engulfing pattern is highly reliable, especially when it occurs at significant support or resistance levels.
Important Considerations
While candlestick patterns offer valuable trading signals, investors should not rely solely on them. It is essential to combine them with other tools such as moving averages (MA), MACD, or support/resistance levels. Additionally, market context and economic news significantly impact the accuracy of candlestick patterns.
Understanding and applying basic candlestick patterns empower investors to make more informed decisions. However, it is advisable to practice on a demo account and rigorously manage risks before venturing into the real market.
“Vietstock Weekly: Shaking Things Up at the Summit”

The VN-Index reached new heights last week, with trading volumes maintained above the 20-week average. The positive outlook is reinforced by the MACD indicator, which continues to rise and diverge from the Signal line since its buy signal in May 2025. However, the index’s slight pullback amid the Stochastic Oscillator’s sell signal in the overbought territory indicates the presence of short-term volatility risks.
Stock Market Update: Riding the Wave or Missing Out?

Today’s session (August 13th) saw the VN-Index fluctuate around the 1,600-point mark multiple times. The intense back-and-forth movement at this strong resistance level has put investors in a tricky situation: buying now risks buying at the peak, but selling early could mean missing out on potential gains. Experts suggest that if the market undergoes a technical correction until the end of August, it would present an opportunity to enter instead of rushing to buy at higher prices.
Technical Analysis for August 11: A Silver Lining Amidst the Gloom.

The VN-Index and HNX-Index both climbed in the morning session, but the lack of significant improvement in liquidity revealed investors’ ongoing dilemma.
Expert Insights: Equities Enter a Phase of Stabilization and Acceleration, with Potential Short-Term Adjustments

“With a consistent upward trajectory over the last four months, a short-term market correction in August is not out of the question. This breather could be necessary to build momentum for conquering new heights,” opined the expert.
“Crypto Report for August 2025 (Part 2): The Optimism Persists”
: The Optimism Persists”")
The world of cryptocurrency is ever-evolving, and keeping abreast of the latest trends is essential for investors. This analysis delves into the critical cryptocurrencies that are on the radar of many astute investors. The insights provided herein offer a compass to navigate the volatile crypto terrain, serving as a reference point for both short-term trades and long-term investment strategies.


