


: Mixed Signals Emerge")

: Short-Term Outlook Continues to Deteriorate")
For new investors (F0), entering the stock market often starts with opening a price sheet. However, many are overwhelmed by the flashing colors and numbers on the screen. Reading a stock price sheet is not as complicated as it seems. By understanding the meaning of the columns and colors, you’ll grasp the market’s pulse and make informed trading decisions.
What is a Stock Price Sheet?
A stock price sheet (or electronic board) is an online tool that displays real-time trading information for stocks on an exchange. It’s like a dynamic “notice board,” updating buy and sell orders, trade prices, and volumes every second. Each exchange (HOSE, HNX, UPCoM) has its price sheet, but most brokerage firms provide a consolidated sheet for investors.
Understanding Color Codes
Green: Stock price is higher than the reference price.
Red: Stock price is lower than the reference price.
Yellow: Stock price is equal to the reference price.
Purple: Stock price hits the daily limit, the highest price allowed for the day.
Blue: Stock price hits the daily lower limit, the lowest price allowed for the day.
For example, VNM stock has a reference price of 70,000 VND. If it’s currently trading at 72,000 VND, the price column will show green. If it hits the daily limit of 74,200 VND, the cell will turn purple.
Key Columns to Understand
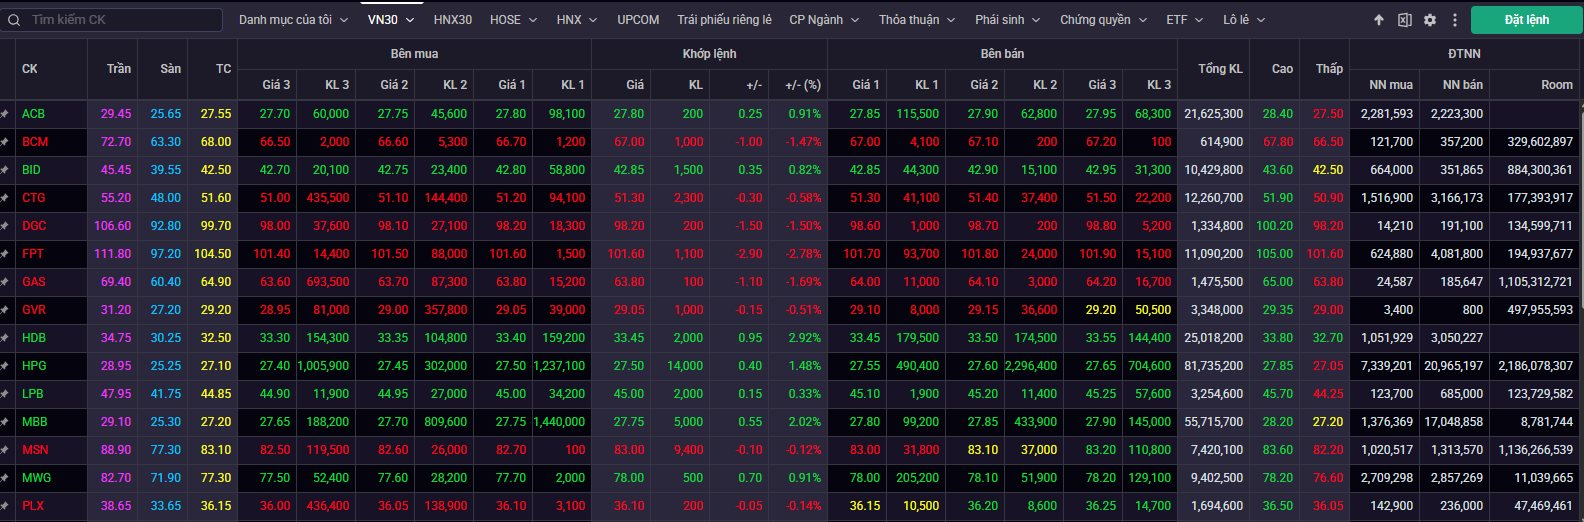
Price sheet for VN30 stocks at the market close on August 29, Source: iboard.ssi.com.vn
While price sheets may vary in layout, they all include these critical columns:
Stock Code: Abbreviation for the company (e.g., VNM for Vinamilk, VIC for Vingroup, CTG for VietinBank)
Reference (Ref): Previous day’s closing price, used to calculate the daily limit and lower limit
Limit and Lower Limit: Maximum and minimum prices allowed for the day’s trading (HOSE ±7%, HNX ±10%, UPCoM ±15% of the reference price)
Buy/Sell Orders: Different price levels at which buyers and sellers have placed their orders, along with the corresponding volumes. This column indicates the current demand and supply for the stock.
Traded Price: Price and volume of the last executed trade.
Total Volume: Total number of shares traded since the market opened.
Net Foreign Buying/Selling: Indicates whether foreign investors are net buyers or sellers of the stock, showing the direction of foreign capital flow.
Market Indices on the Price Sheet
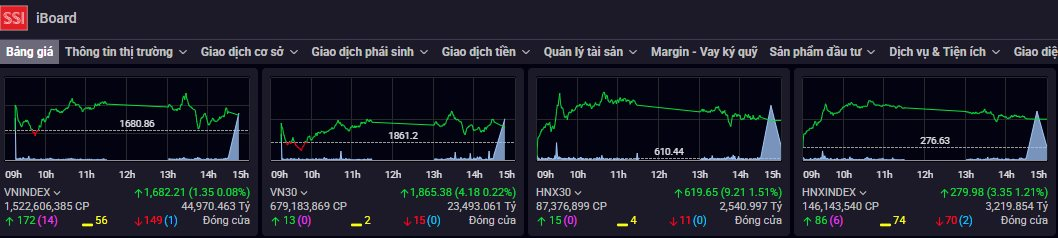
Market indices at the close of trading on August 29, Source: iboard.ssi.com.vn
In addition to individual stocks, the price sheet provides an overview of the market:
VN-Index, HNX-Index, UPCoM-Index: Representing each exchange, these indices reflect the overall market trend.
Market Color: If most stocks are green, the market is bullish; if most are red, it’s undergoing a correction.
Market Turnover: Total value of shares traded across the market (in trillions of VND). It indicates the market’s liquidity and the strength of money flow.
Tips for F0 Investors Using Price Sheets
Don’t Focus Solely on Colors: Green and red colors fluctuate, but the overall trend matters more.
Consider Volume: A rising stock price with low volume may not indicate a sustainable uptrend.
Combine with Market Indices: Don’t look at individual stocks in isolation; compare them to the broader market trend.
Avoid FOMO: Buying a stock just because it hits the daily limit can lead to buying at the peak.
Use as a Tool, Not a Crystal Ball: Price sheets are informative, but investment decisions should also consider fundamental and technical analysis.
Understanding a stock price sheet is like learning a new language: grasping stock codes, colors, and data columns is key to market insight. For F0 investors, it’s a gateway to the market, but it’s crucial to look beyond colors. Combining price sheets with fundamental analysis and investment discipline will turn this tool into a valuable map for your stock market journey.


