


The stock market continued its upward trend in August. A recent strategy report from BIDV Securities (BSC) reveals that since April 2025, the VN-Index has surged by over 55% in approximately 20 weeks, with only a minor 2% correction.
Looking back at the Vietnamese stock market’s historical cycles, each “tsunami wave” has left its unique mark. Notably, during 2005-2007, the VN-Index soared by 346% over 74 weeks. Starting at a P/E ratio of 26.37, it peaked at 49.82, reflecting extreme market exuberance. The most significant correction within this wave saw a nearly 37% drop before resuming its upward trajectory.
The second wave occurred from February to October 2009, with the market rebounding spectacularly by over 165% in just over six months.
The third wave took place during 2016–2018, with the index climbing more than 130% over roughly two years. Liquidity improved significantly, averaging over VND 3,800 billion per session.
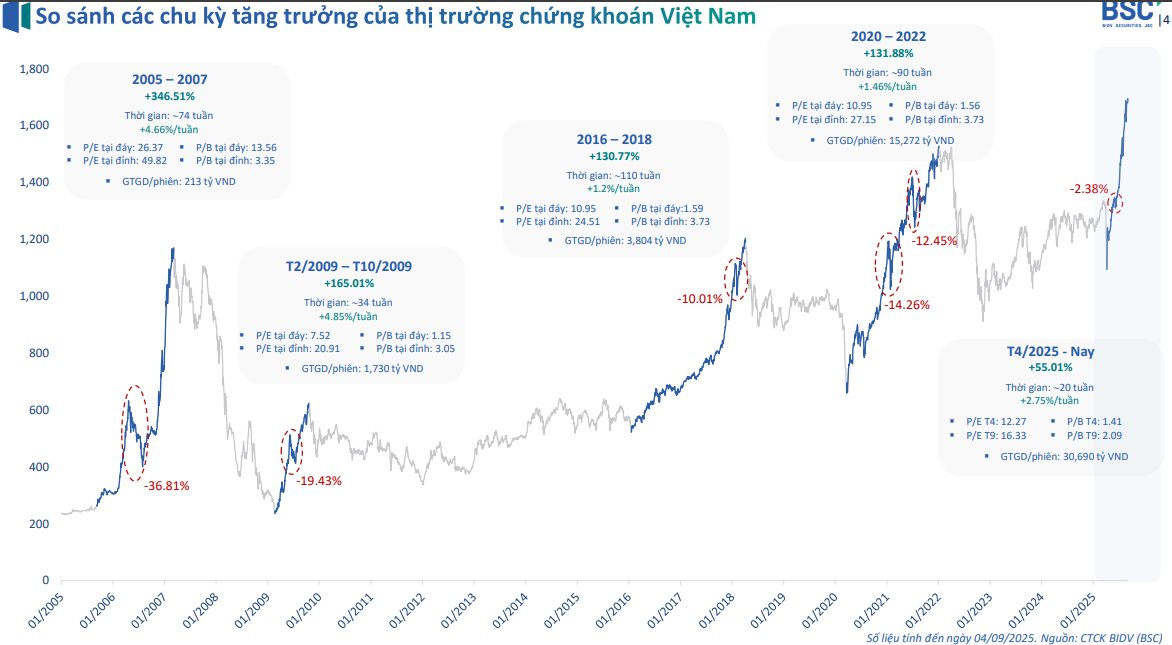
From 2020 to 2022, Vietnamese stocks witnessed another robust growth wave post-Covid-19. In less than two years, the index rose by over 131%, with record liquidity exceeding tens of trillions of VND per session, fueled by new retail investor capital. However, after peaking, the market underwent deep corrections, falling 12-14%.
Currently, since April 2025, the market appears to be entering its fifth “tsunami wave.” In just 20 weeks, the VN-Index has climbed over 55%, outpacing previous cycles. Liquidity has surged to record highs, averaging over VND 30,000 billion per session, signaling strong capital inflows.
Notably, the current P/E valuation remains moderate, significantly lower than peaks in prior cycles.
Macroeconomic Context Across Growth Cycles
According to BSC, during 2005-2007, Vietnam’s economy boomed, with average GDP growth exceeding 7% annually. Inflation was high, averaging over 8% CPI, while credit growth surged, averaging more than 30% yearly.
Monetary policy was tight, with a base interest rate around 6.3%. Fiscal policy was expansionary, with increased public spending leading to a widening budget deficit.
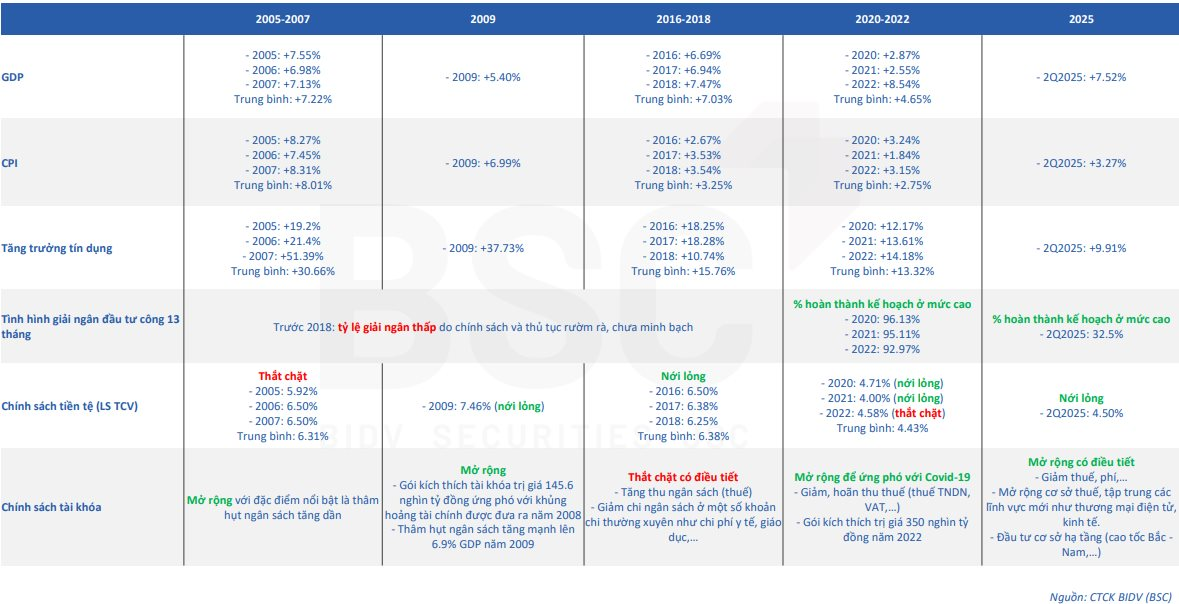
For the 2009 wave, post-global financial crisis, Vietnam’s GDP slowed to around 5.4%. CPI stood at 6.99%, lower than the previous period. The government launched a massive fiscal stimulus package worth VND 145.6 trillion, nearly 7% of GDP, injecting capital into the economy. Credit growth hit over 37% in a single year, with a base interest rate of 7.46%.
During 2016-2018, the macroeconomic environment stabilized. GDP grew steadily at around 7% annually, while inflation averaged just over 3%. Credit growth moderated to around 15.7% yearly, significantly lower than 2005–2007. Monetary policy was accommodative, with a base rate of 6.38%. Fiscal policy tightened, focusing on revenue increases and reduced spending on healthcare and education, fostering a balanced economy and a sustainable stock market rally.
The 2020-2022 wave coincided with the Covid-19 pandemic. GDP growth averaged just over 4.6%, significantly lower than pre-pandemic levels. CPI remained stable at around 2.7%. The government implemented expansionary fiscal policies, including tax cuts, deferrals, and a VND 350 trillion stimulus package in 2022. Credit growth averaged over 13% annually.
Monetary policy shifted annually, initially loosening before tightening to control inflation. This supported the post-Covid stock market boom but also led to adjustment pressures when policies reversed.
Currently, the macroeconomic outlook is brighter. In the first half of 2025, GDP grew by 7.52%, outpacing recent years. CPI remained stable at 3.27%. Credit growth reached nearly 10% in the first half, reflecting strong capital injection into the economy.


