


")


Technical Signals of VN-Index
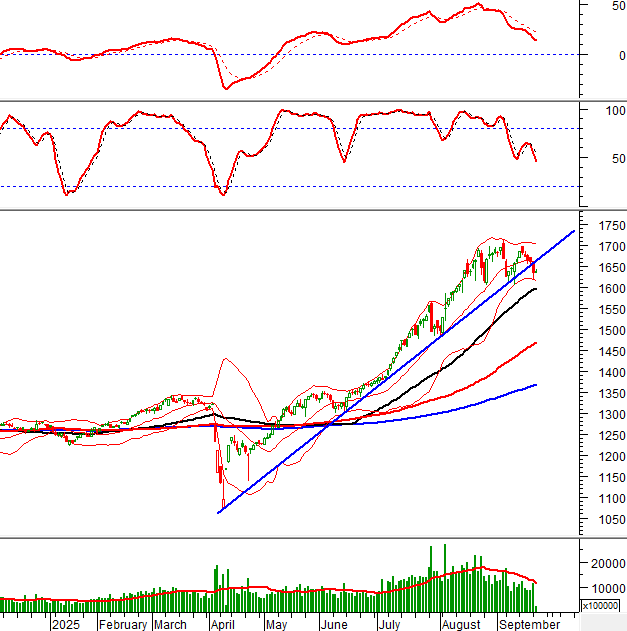
During the morning trading session on September 23, 2025, the VN-Index halted its decline as it approached the previous August 2025 low (equivalent to the 1,600-1,630 point range).
Trading volume is expected to remain below the 20-day average as investors exercise caution.
Technical Signals of HNX-Index
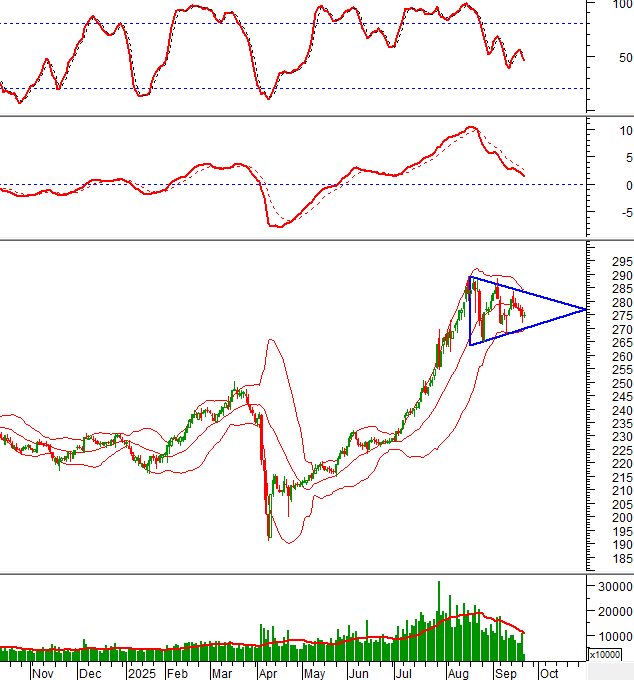
During the morning trading session on September 23, 2025, the HNX-Index experienced strong volatility with a Long Upper Shadow candlestick pattern.
As the index has fallen below the Middle line of the Bollinger Bands, this level will act as resistance in the near term.
The HNX-Index is likely to retest the lower boundary of the Triangle pattern (equivalent to the 269-272 point range) this week.
ACB – Asia Commercial Bank
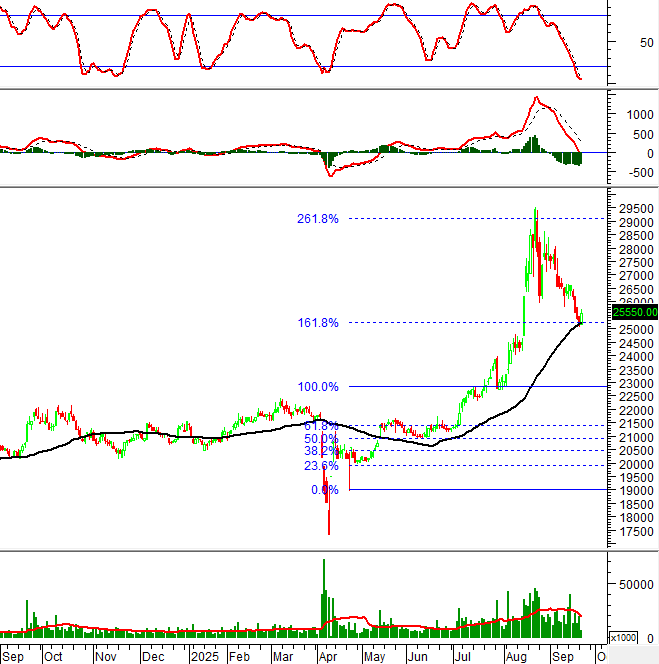
On the morning of September 23, 2025, ACB share prices reversed their trend, rising after four consecutive declining sessions. The stock is currently supported by the 50-day SMA, indicating reduced investor pessimism.
At present, ACB has rebounded after testing the 161.8% Fibonacci Projection level (equivalent to the 25,000-25,500 range), while the Stochastic Oscillator has entered the oversold territory. If the indicator provides a buy signal and moves above this range in upcoming sessions, the recovery prospects will be strengthened.
DCM – Petrovietnam Fertilizer and Chemicals Corporation
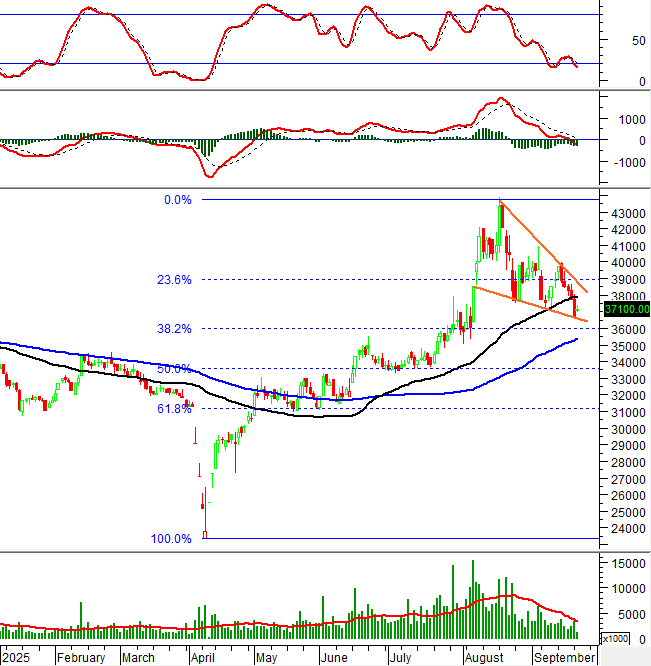
During the morning trading session on September 23, 2025, DCM share prices rebounded after five consecutive declining sessions, accompanied by a Harami Cross candlestick pattern, signaling weakened price volatility and reduced investor pessimism.
Additionally, the stock is forming a Falling Wedge pattern and is nearing the 38.2% Fibonacci Retracement level (equivalent to the 36,000-36,800 range).
With the Stochastic Oscillator in oversold territory, a buy signal and a move above this range would indicate imminent recovery prospects.
(*) Note: The analysis in this article is based on real-time data as of the end of the morning trading session. Therefore, the signals and conclusions are for reference only and may change after the afternoon session concludes.
Technical Analysis Department, Vietstock Advisory Division
– 12:04 September 23, 2025
Market Liquidity Weakens as Capital Flows Out of Equity Securities

In recent weeks, cash flow has shown signs of weakening. Despite this trend, certain sectors continue to attract investment. Conversely, the financial sector, particularly stocks, has experienced significant outflows.
Vietstock Daily 24/09/2025: Liquidity Hits Record Low

The VN-Index formed a Doji candlestick pattern, accompanied by a sharp decline in trading volume below the 20-session average, indicating persistent market caution. With both the Stochastic Oscillator and MACD continuing to weaken following sell signals, the August 2025 low (around 1,600-1,630 points) is expected to serve as short-term support for the index.
Foreign Block Net Sells Nearly VND 1.8 Trillion Amid VN-Index Volatility: Which Stocks Are the Focus of the Sell-Off?

Foreign investors engaged in robust net selling during the September 22nd session, with selling pressure concentrated on the Ho Chi Minh Stock Exchange (HOSE), totaling VND 1,733 billion.
Proprietary Trading Firms Inject Nearly VND 400 Billion into Vietnamese Stocks Amid Sharp Market Decline: What Are the Key Targets for Accumulation?

Proprietary trading desks at securities companies recorded a net buy of VND 375 billion on the Ho Chi Minh City Stock Exchange (HOSE).
Stock Market Plunges Over 40 Points Before Rebounding: Investors Face Losses Amid Sudden Sell-Off

Technically speaking, experts note that key indicators have collectively breached the support zone of the 20-day moving average, signaling a clear short-term correction.


