


: Mixed Signals Emerge")

: Short-Term Outlook Continues to Deteriorate")
I. MARKET ANALYSIS OF THE UNDERLYING STOCK MARKET ON SEPTEMBER 29, 2025
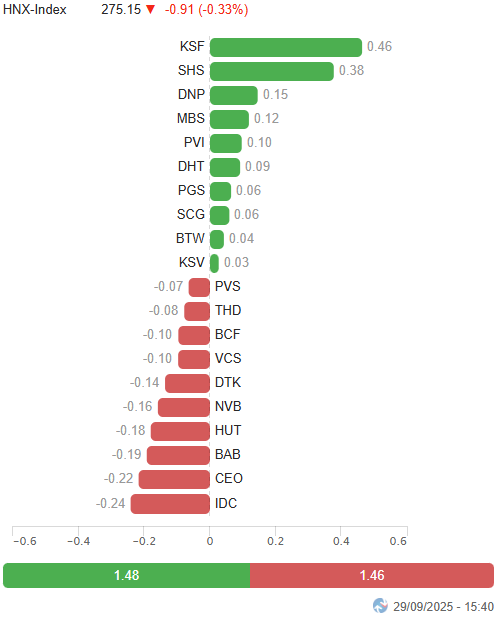
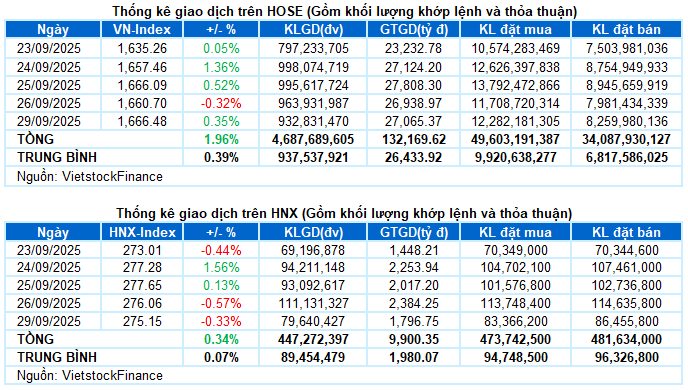
– Key indices showed mixed movements during the September 29 trading session. Specifically, the VN-Index rose by 0.35%, reaching 1,666.48 points. In contrast, the HNX-Index fell by 0.33%, closing at 275.15 points.
– Trading volume on the HOSE continued to decline by 10.1%, totaling nearly 809 million units. The HNX recorded approximately 70 million matched units, a 28.1% decrease compared to the previous session.
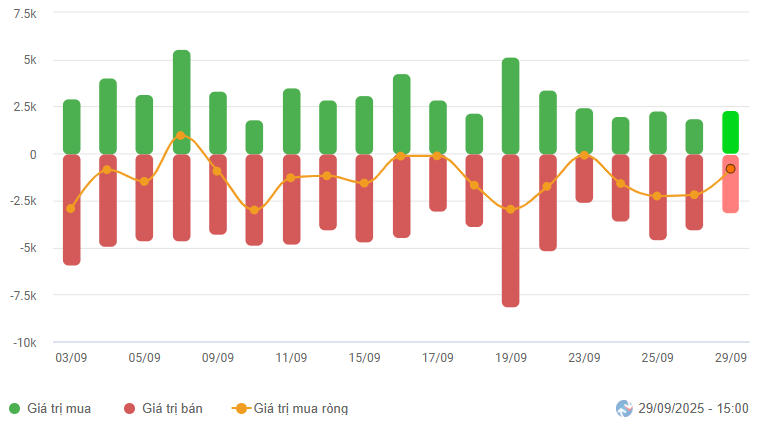
– Foreign investors narrowed their net selling to nearly VND 760 billion on the HOSE and VND 36 billion on the HNX.
Foreign Investors’ Trading Value on HOSE, HNX, and UPCOM by Date. Unit: Billion VND
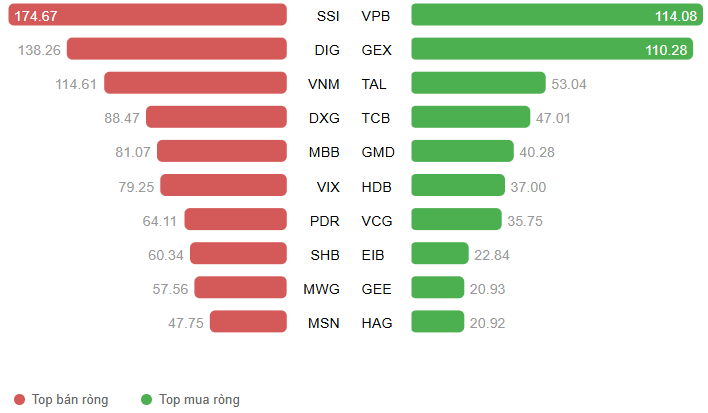
Net Trading Value by Stock Code. Unit: Billion VND
– The market kicked off the new week on a less-than-positive note, with a “green shell, red core” scenario. The VN-Index fluctuated around the 1,660-point mark in the first half of the morning session before gradually rising, driven by strong support from blue-chip stocks, particularly VIC and VHM, which acted as the primary catalysts. However, market breadth remained negative, with declining stocks outnumbering advancing ones. This polarization persisted into the afternoon session, indicating that the index’s upward momentum relied heavily on a few large-cap stocks, while the broader market lacked consensus. The VN-Index closed at 1,666.48 points, up 0.35% from the previous session.
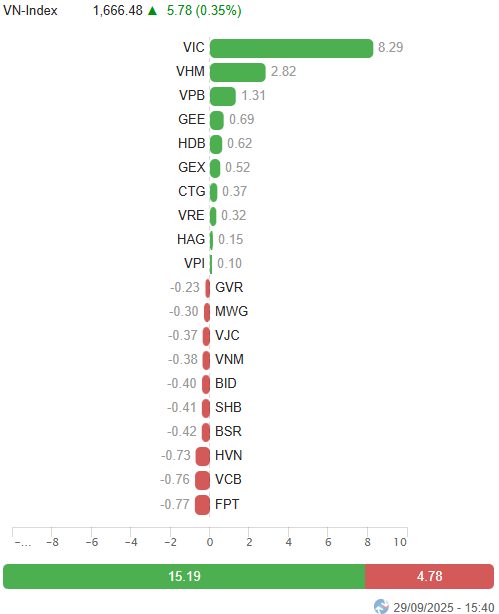
– In terms of influence, VIC led the way, contributing 8.3 points to the VN-Index. VHM and VPB followed, adding a combined total of over 4 points. Conversely, FPT, VCB, and HVN exerted the most downward pressure, subtracting more than 2 points from the index.
Top Stocks Influencing the Index. Unit: Points
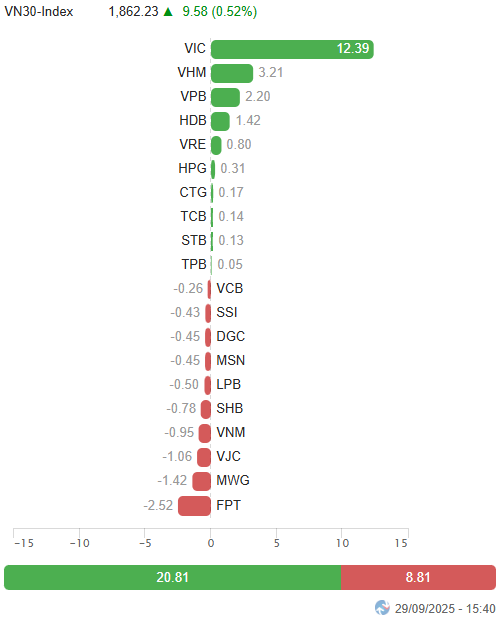
– The VN30-Index closed up 9.58 points (+0.52%), at 1,862.23 points. However, declining stocks outnumbered advancing ones, with 18 stocks falling, 10 rising, and 2 remaining unchanged. Notably, SHB, VJC, and FPT saw significant declines of over 2%, followed by DGC, VNM, SSI, and MWG, each losing more than 1%. On the flip side, VIC continued to shine, surging by 5.4%, while VHM, HDB, VPB, and VRE all rose by over 2%.
Sector performance was polarized. The real estate sector led the gains, with standout performers including VIC (+5.37%), VHM (+2.93%), VRE (+2.04%), KSF (+2.56%), NLG (+1.95%), and VPI (+2.36%). However, several real estate stocks faced strong selling pressure, such as DXG (-3.96%), SSH (-14.44%), PDR (-2.65%), DIG (-2.98%), CEO (-2.24%), and SIP (-2.61%).
The financial and industrial sectors experienced narrow fluctuations, with a mix of green and red. While several stocks maintained strong demand, including VPB (+2.3%), SHS (+2.43%), HDB (+2.49%), VCI (+1.16%), CTS (+3.35%), GEX (+4.53%), VCG (+1.08%), HHV (+0.9%), and GEE hitting the ceiling, many others declined by over 1%, such as SHB, SSI, EVF, VSC, VJC, CTD, VGC, DPG, ACV, FCN, and HVN…
Meanwhile, the information technology sector underperformed, falling by 1.91%, primarily due to declines in FPT (-2.05%), CMG (-0.13%), ELC (-0.43%), DLG (-2.02%), and VEC (-4%).
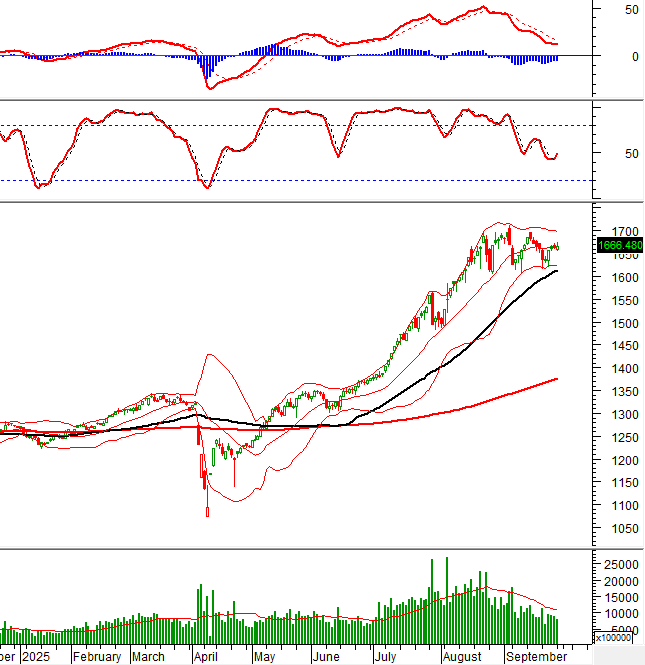
The VN-Index rose and crossed back above the Middle line of the Bollinger Bands. However, trading volume declined for the fourth consecutive session and remained below the 20-session average, indicating persistent investor caution. Currently, the Stochastic Oscillator has issued a buy signal. If the MACD follows suit in the coming sessions, the potential for sustained upward momentum will increase.
II. PRICE TREND AND VOLATILITY ANALYSIS
VN-Index – Stochastic Oscillator Signals Buy
The VN-Index rose and crossed back above the Middle line of the Bollinger Bands. However, trading volume declined for the fourth consecutive session and remained below the 20-session average, reflecting ongoing investor caution.
Currently, the Stochastic Oscillator has issued a buy signal. If the MACD follows suit in the coming sessions, the potential for sustained upward momentum will increase.
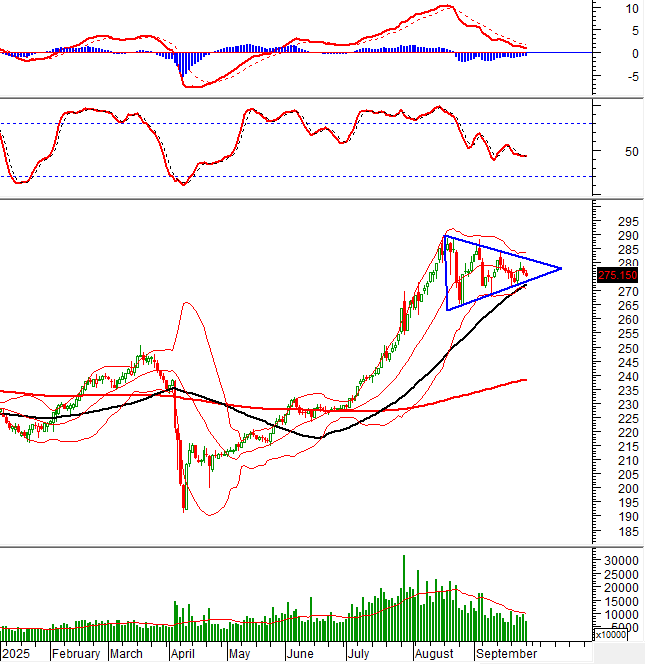
HNX-Index – Trading Sideways in a Triangle Pattern
The HNX-Index dipped slightly and continued to trade sideways within a Triangle pattern. Given the persistently low trading volume, this situation is likely to continue in the near term.
The Bollinger Bands are tightening significantly, so investors should closely monitor the HNX-Index‘s position relative to the Middle line. If the index remains above the Middle line when the Bollinger Bands expand again, the outlook will become more positive.
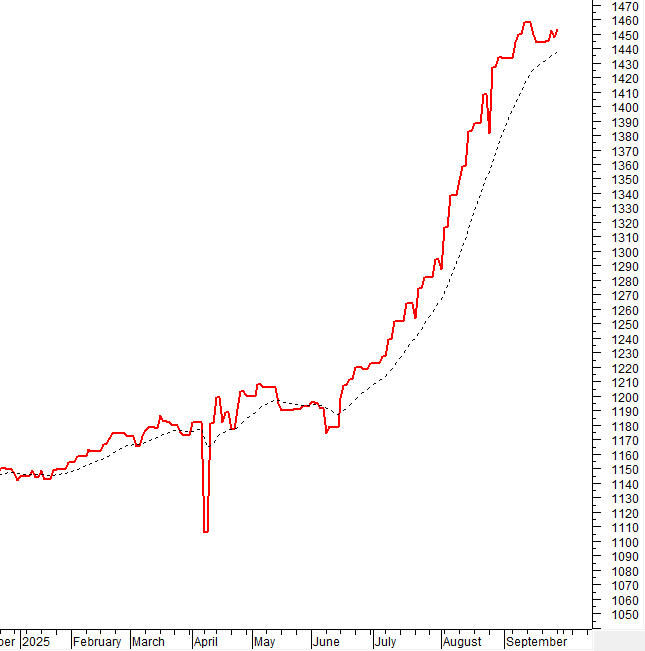
Capital Flow Analysis
Smart Money Movement: The Negative Volume Index of the VN-Index is currently above the 20-day EMA. If this condition persists in the next session, the risk of a sudden downturn (thrust down) will be mitigated.
Foreign Capital Movement: Foreign investors continued to sell net during the September 29, 2025, trading session. If foreign investors maintain this trend in the upcoming sessions, the outlook will become more pessimistic.
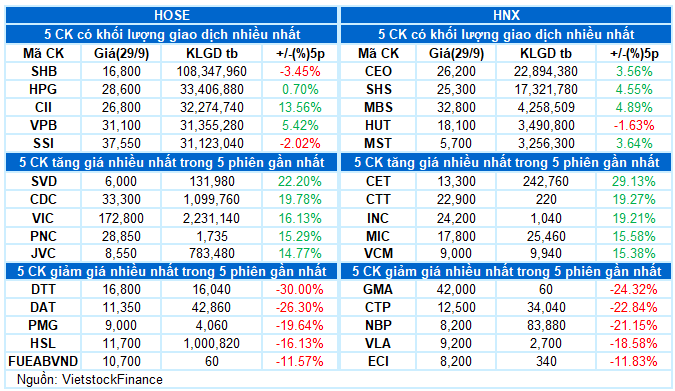
III. MARKET STATISTICS FOR SEPTEMBER 29, 2025
Economic & Market Strategy Analysis Department, Vietstock Consulting Division
– 17:03 September 29, 2025
Mid and Small-Cap Real Estate Stocks Attract Investment Despite Market Liquidity Decline

The market has entered a phase of consolidation, with investor sentiment waning as evidenced by the consistent decline in trading volume over recent weeks.
Market Pulse 29/09: Continued Divergence in Market Trends

At the close of trading, the VN-Index climbed 5.78 points (+0.35%) to reach 1,666.48, while the HNX-Index dipped 0.91 points (-0.33%) to 275.15. Market breadth favored decliners, with 469 stocks falling and 258 advancing. Similarly, the VN30 basket saw red dominate, as 18 members declined, 10 rose, and 2 remained unchanged.
VN-Index’s Deceptive Rally Leaves Investors Facing Heavy Losses

The stock market’s deceptive “green on the outside, red on the inside” state has left many investors’ accounts in the red, as losses mount despite superficial signs of stability.
Vietnam Stock Market Outlook for the Year-End: Expert Insights

Market experts and leading securities firms unanimously predict that the stock market retains significant growth potential in the final months of the year.
Foreign Investors’ Massive Sell-Off: Unveiling the Focus of the VNĐ 800 Billion Offload on September 29th

In the afternoon trading session, VPB and GEX emerged as the top net buyers in the market, with net purchase values of 114 billion and 111 billion, respectively.


