


: Mixed Signals Emerge")

: Short-Term Outlook Continues to Deteriorate")
I. MARKET ANALYSIS OF THE UNDERLYING STOCK MARKET ON SEPTEMBER 30, 2025
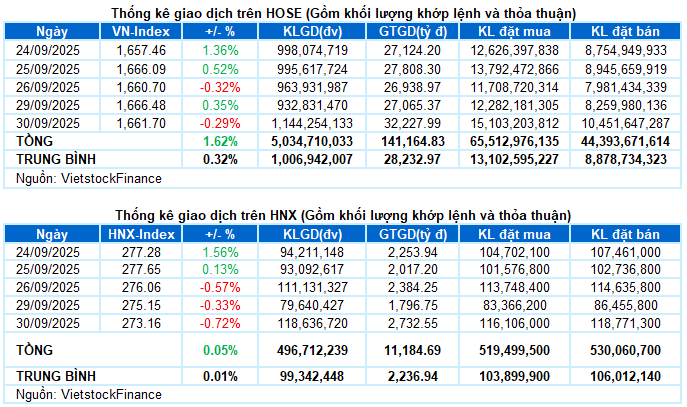
– Major indices closed in the red on September 30. Specifically, the VN-Index fell by 0.29%, closing at 1,661.7 points, while the HNX-Index dropped by 0.72%, ending at 273.16 points.
– Trading volume on the HOSE increased by 29.7%, surpassing 1 billion units. The HNX recorded over 104 million units traded, a 50.5% rise compared to the previous session.
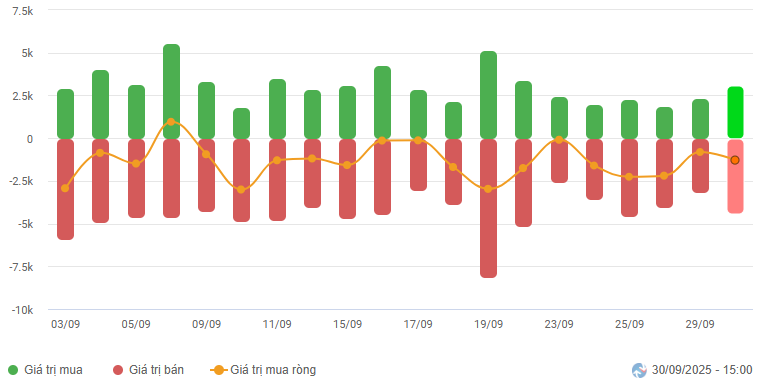
– Foreign investors continued to net sell, with a value of nearly VND 1.3 trillion on the HOSE, but turned to net buying on the HNX with nearly VND 18 billion.
Foreign Investors’ Trading Value on HOSE, HNX, and UPCOM by Date. Unit: Billion VND
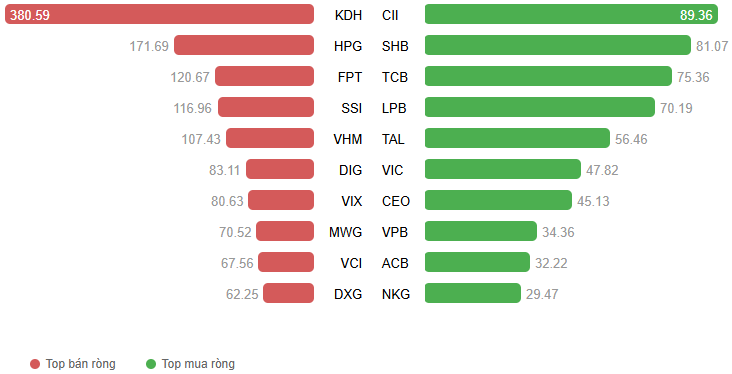
Net Trading Value by Stock Code. Unit: Billion VND
– The market experienced intense tug-of-war during the final trading session of September. The previous session’s scenario repeated, with support primarily from Vingroup stocks, while most others remained in the red, with even more pronounced negativity. The VN-Index lost its reference level from the end of the morning session and plunged over 20 points in the early afternoon. However, bottom-fishing demand intervened in time, significantly narrowing the index’s decline by the close. The VN-Index ended with a nearly 5-point drop compared to the previous session, closing at 1,661.7 points.
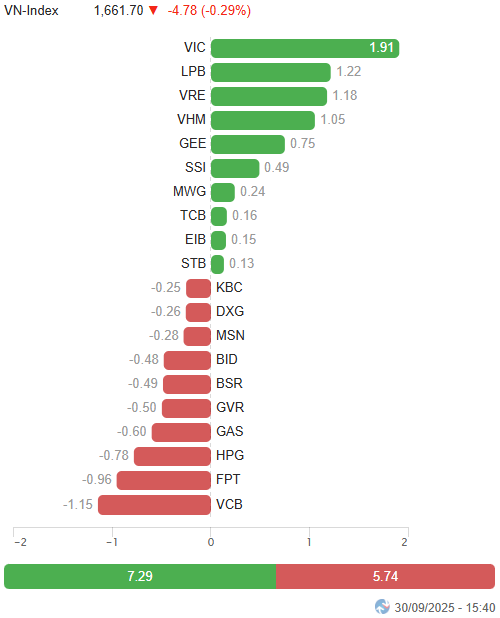
– In terms of impact, VCB, FPT, and HPG were the major drags on the VN-Index, taking away nearly 3 points from the index. Meanwhile, the Vingroup trio (VIC, VHM, and VRE) along with LPB retained a total of over 5 points, but it wasn’t enough to turn the index green.
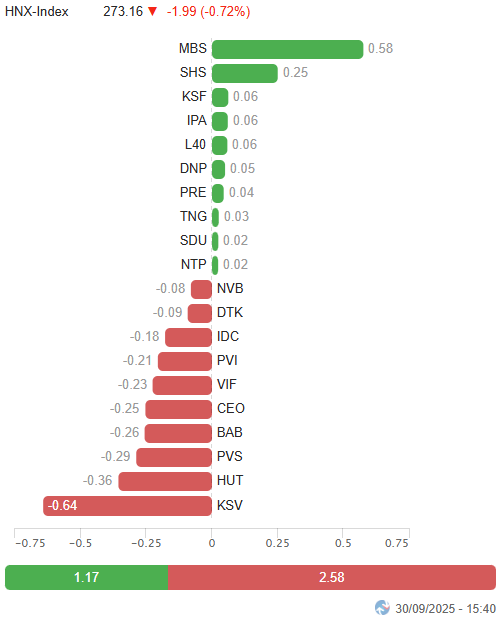
Top Stocks Influencing the Index. Unit: Points
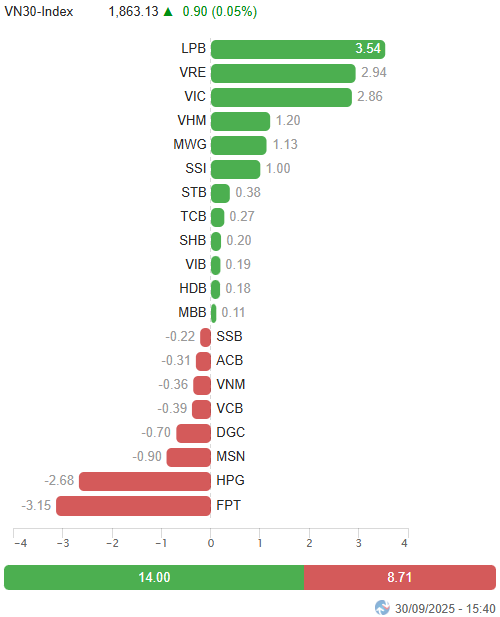
– The VN30-Index closed near the reference level at 1,863.13 points. Sellers slightly outnumbered buyers with 16 declining stocks, 12 advancing stocks, and 2 unchanged stocks. Among these, FPT and DGC faced heavy pressure, falling by 2.6% and 2.3%, respectively. They were followed by GVR, GAS, PLX, and HPG, all losing over 1.5%. In contrast, VRE led the gainers with a strong purple performance, followed by LPB, SSI, VIC, and VHM, all rising between 1-4%.
Red dominated most sectors. The information technology sector continued to lag, losing nearly 2.5%, with ongoing adjustments in FPT (-2.62%), CMG (-0.63%), DLG (-1.37%), VEC (-2.7%), POT (-5.07%), and HPT (-1.79%).
Energy, materials, and communication services sectors also declined over 1.5% as red prevailed widely. Numerous stocks faced strong profit-taking pressure, including BSR (-2.6%), PLX (-1.58%), PVS (-2.67%), PVT (-1.89%), HPG (-1.57%), GVR (-1.95%), DGC (-2.34%), KSV (-2.99%), MSR (-3.72%), VGI (-2.02%), CTR (-1.95%), and YEG (-3.39%).
On the flip side, real estate was a rare bright spot, rising 0.77%, driven by a few large-cap stocks like VRE hitting its upper limit, VIC (+1.22%), VHM (+1.08%), and SSH (+12.28%). Meanwhile, many others plunged, including DXG (-5.26%), DIG (-4.51%), CEO (-2.67%), KBC (-3.22%), NVL (-2.24%), IDC (-2.04%), NLG (-3.83%), SCR (-2.05%), and DXS (-3.16%).
The financial sector significantly contributed to narrowing the afternoon session’s decline, highlighted by brokerage stocks such as SSI (+2.66%), VND (+1.35%), SHS (+1.58%), MBS (+4.27%), DSE (+2.98%), and VDS (+2.52%).
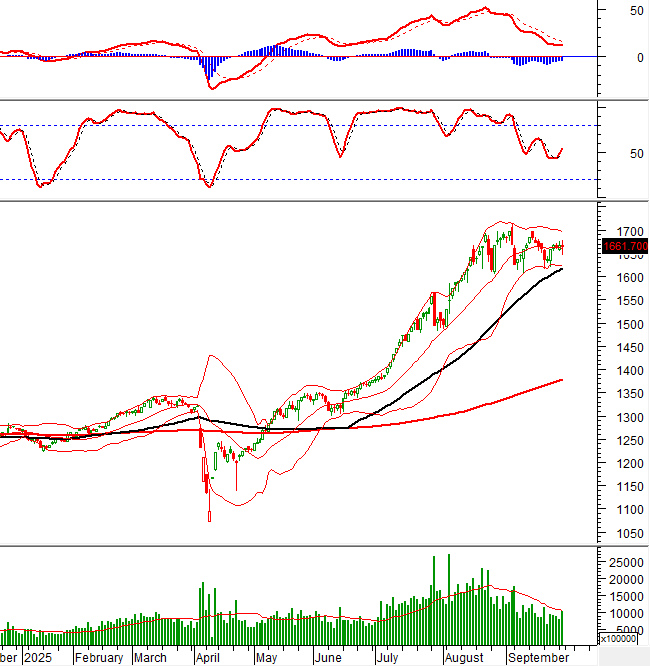
The VN-Index continued to struggle around the Middle line of the Bollinger Bands. Although the Stochastic Oscillator indicator has signaled a rebound, the oscillation process is not yet complete. The August 2025 low (equivalent to the 1,600-1,630 point range) will remain a critical support level for the index in the near term.
II. PRICE TREND AND VOLATILITY ANALYSIS
VN-Index – Struggling Around the Middle Line of the Bollinger Bands
The VN-Index continued to struggle around the Middle line of the Bollinger Bands.
The Stochastic Oscillator indicator has signaled a rebound, but the oscillation process is not yet complete. The August 2025 low (equivalent to the 1,600-1,630 point range) will remain a critical support level for the index in the near term.
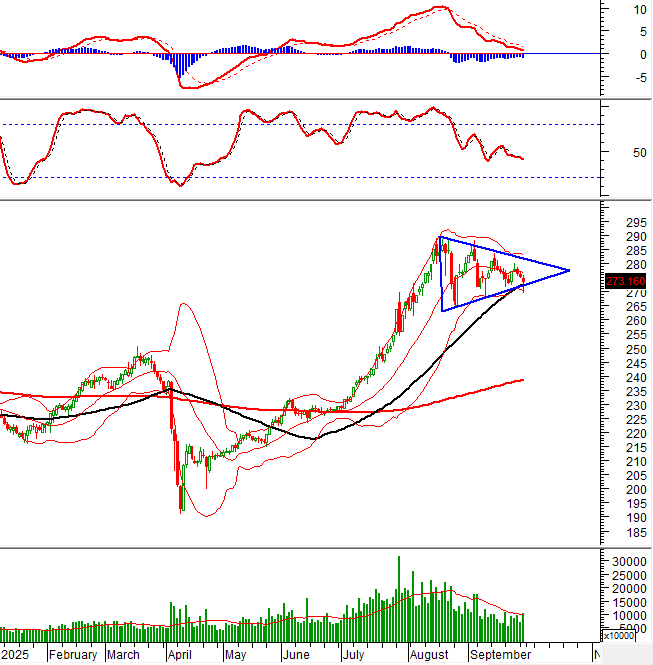
HNX-Index – Testing the Lower Edge of the Triangle Pattern
The HNX-Index narrowed its decline after testing the lower edge of the Triangle pattern.
However, the index’s short-term outlook remains uncertain as the Stochastic Oscillator and MACD indicators continue to maintain sell signals.
Capital Flow Analysis
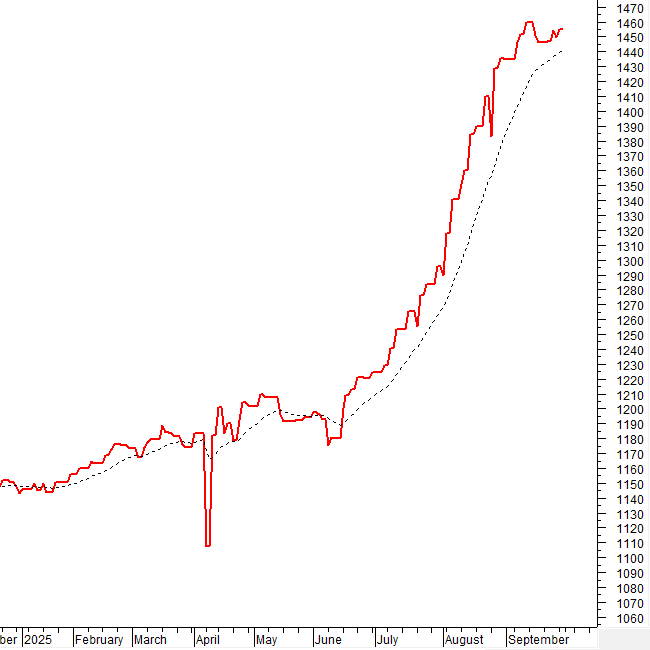
Smart Money Flow: The Negative Volume Index of the VN-Index is above the 20-day EMA. If this condition persists in the next session, the risk of a sudden downturn (thrust down) will be limited.
Foreign Capital Flow: Foreign investors continued to net sell in the September 30, 2025 session. If foreign investors maintain this action in upcoming sessions, the situation will become even more pessimistic.
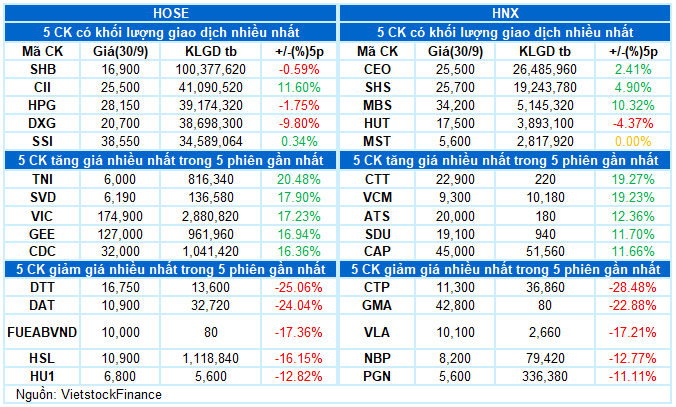
III. MARKET STATISTICS ON SEPTEMBER 30, 2025
 Economic & Market Strategy Analysis Department, Vietstock Consulting
– 17:15 September 30, 2025
September 29th Session: Securities Companies’ Proprietary Trading Desks Net Sell VND 500 Billion – Which Stocks Were Hit Hardest?

Proprietary trading firms net sold VND 486 billion on the HoSE.
Stock Market Tomorrow, September 30: Unpredictable Shifts in Capital Flows Expected!

Cash flow divergence persists among stock groups, a trend likely to extend into the September 30th session.
September 30th Session: Brokerage Firms’ Proprietary Trading Desks Net Sell Half a Trillion Dong – Which Stocks Were Hit Hardest?

Proprietary trading desks at securities companies recorded a net sell of VND 523 billion on the Ho Chi Minh City Stock Exchange (HOSE).
Over 90% of Stock Charts Signal a Downtrend: What’s Driving the Market Decline?

The stock market has entered a brief cooling-off period, while leading indicator sectors are experiencing widespread adjustments ahead of several significant market events.
The IPO Boom Amidst a Stock Market Frenzy

Vietnam’s Initial Public Offering (IPO) market is experiencing an unprecedented boom, fueled by a surging stock market, new regulatory reforms, and a credit explosion.


