


 Lists on HOSE: Unlocking the Value of Masan’s Ecosystem in the Capital Market?")


: Mixed Signals Emerge")

: Short-Term Outlook Continues to Deteriorate")
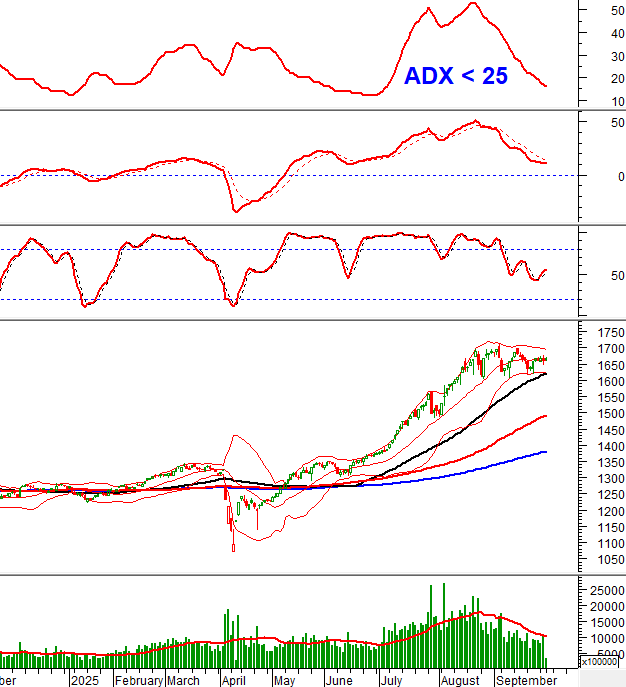
Technical Signals of VN-Index
During the morning trading session on October 1, 2025, the ADX continued to decline, settling at 16. This low level, below 25, indicates a weak trend.
As a result, the VN-Index is expected to remain in a sideways movement around the Middle line of the Bollinger Bands.
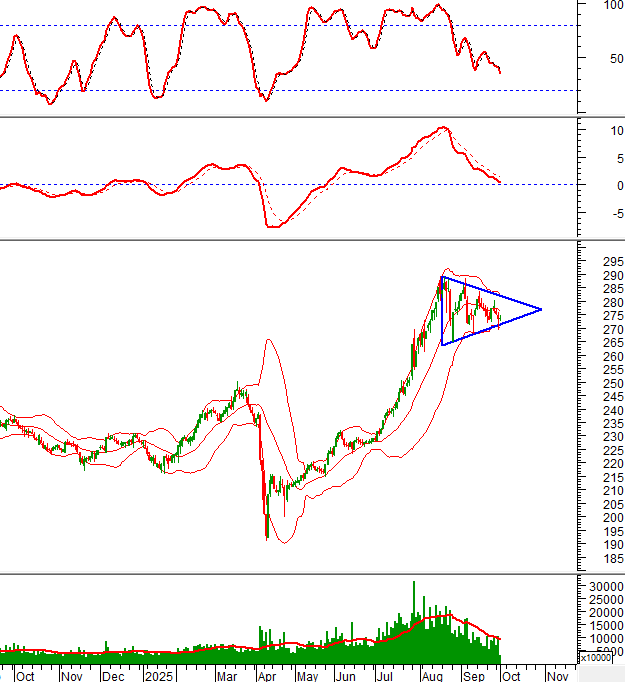
Technical Signals of HNX-Index
In the morning session on October 1, 2025, the HNX-Index formed a Doji candlestick pattern, reflecting short-term investor hesitation.
The index is finding strong support at the lower edge of the Triangle pattern (around 270-272 points).
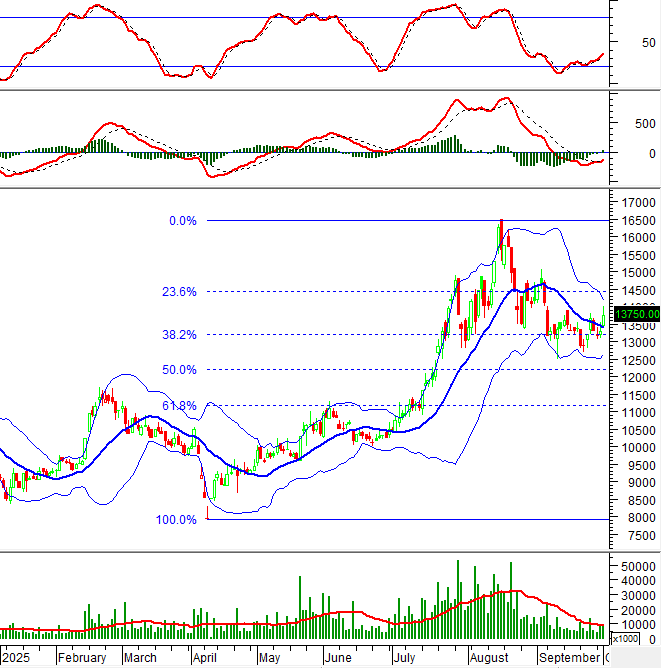
EVF – Vietnam Electricity Finance Joint Stock Company
On the morning of October 1, 2025, EVF shares continued to rise, trading above the Middle line of the Bollinger Bands. The volume is expected to surpass the average by the end of the session, indicating optimistic investor sentiment.
Additionally, the stock price is well-supported at the 38.2% Fibonacci Retracement level (around 13,000-13,500). The Stochastic Oscillator has also continued to rise after generating a buy signal, exiting the oversold territory. If these signals persist, a short-term recovery scenario is highly likely.
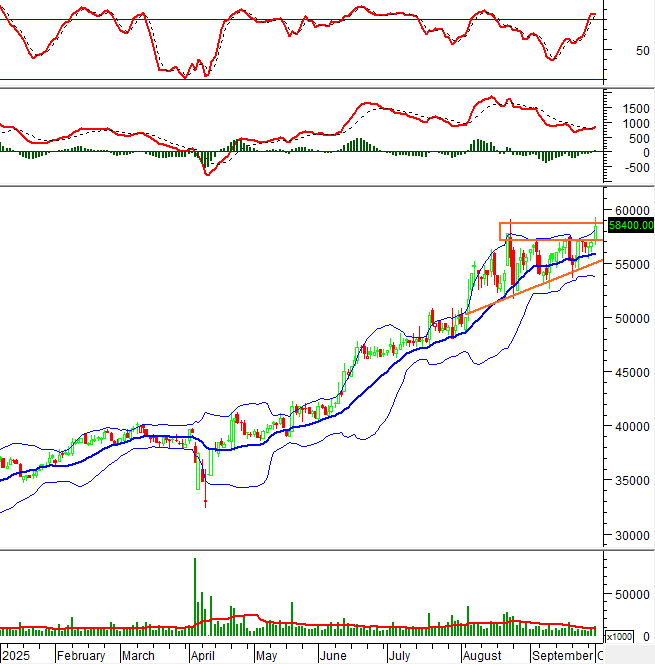
STB – Saigon Thuong Tin Commercial Joint Stock Bank
During the morning session on October 1, 2025, STB shares rose, closely following the Upper Band of the Bollinger Bands. Trading volume improved, surpassing the 20-session average, reflecting increased investor optimism.
Currently, STB is retesting the upper edge (around 57,000-58,700) of the Ascending Triangle pattern, with the MACD indicator already generating a buy signal. If the technical signals continue to improve and STB successfully breaks through this level, the potential price target is 66,500-67,500.
(*) Note: The analysis in this article is based on real-time data as of the end of the morning session. Therefore, the signals and conclusions are for reference only and may change by the end of the afternoon session.
Technical Analysis Department, Vietstock Advisory Division
– 12:08 October 1, 2025
Vietnam’s Stock Market: Scaling New Heights in a Historic Ascent

According to HSC Securities experts, while short-term weakening signals or the possibility of breaching the 1,600-point support level exist, they do not alter the positive long-term outlook for Vietnam’s stock market.
Foreign Block Continues Net Selling Streak with VND 1.8 Trillion in Early October: Which Stocks Were Hit Hardest?

Foreign investors’ trading activity has been a notable drawback, as they engaged in substantial net selling across all three major exchanges.
Surprise Powerhouse Deploys Nearly $300 Billion to Sweep Up Vietnamese Stocks in Month’s Opening Session

Proprietary trading desks at securities companies recorded a net buy of VND 285 billion on the Ho Chi Minh City Stock Exchange (HOSE).
Market Pulse 01/10: VN-Index Sustains Green at 1,665 Points

At the close of trading, the VN-Index climbed 3.35 points (+0.2%) to reach 1,665.05, while the HNX-Index edged up 0.06 points (+0.02%) to 273.22. Market breadth favored the bulls, with 418 gainers outpacing 295 decliners. Similarly, the VN30 basket saw green dominate, as 22 constituents advanced, 6 retreated, and 2 remained unchanged.
Vietstock Daily 02/10/2025: Prolonged Accumulation Ahead?

The VN-Index continues to oscillate around the Middle Bollinger Band, forming a Doji candlestick pattern. Alternating sessions of gains and losses on low liquidity suggest the market is not yet primed for a breakout, indicating that sideways consolidation is likely to persist in the near term.


