


: Has the Year of Defense Arrived?")


: Mixed Signals Emerge")
XRP: Short-Term Outlook Remains Bearish
On the weekly chart, XRP has rebounded from a sharp decline, retesting the April 2025 lows ($1.36–$1.93 USD). Currently, it trades below the middle band of the Bollinger Bands, indicating persistent bearish sentiment in the near term.
Additionally, the Stochastic Oscillator continues to weaken, maintaining a sell signal, which further underscores short-term pessimism.
Meanwhile, the ADX indicator has entered the gray zone (20 < ADX < 25), suggesting indecision in trend strength.
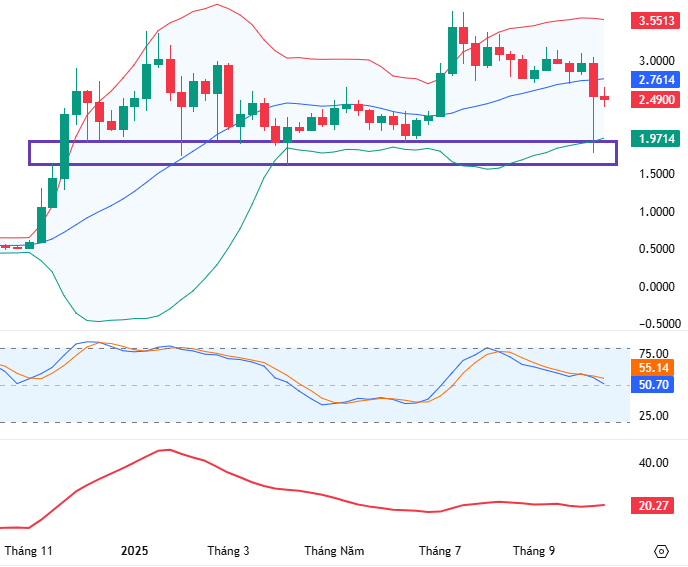
XRP Chart (2024–2025) – Source: TradingView
On the daily chart, XRP is testing the 200-day SMA after a Death Cross between the 50-day and 100-day SMAs in early October 2025. This reinforces the bearish outlook for the coming weeks.
Furthermore, XRP is pulling back to retest the lower boundary ($2.65–$2.70 USD) of a broken Descending Triangle pattern. The MACD remains bearish, forming lower highs and lows, signaling continued downside risk.
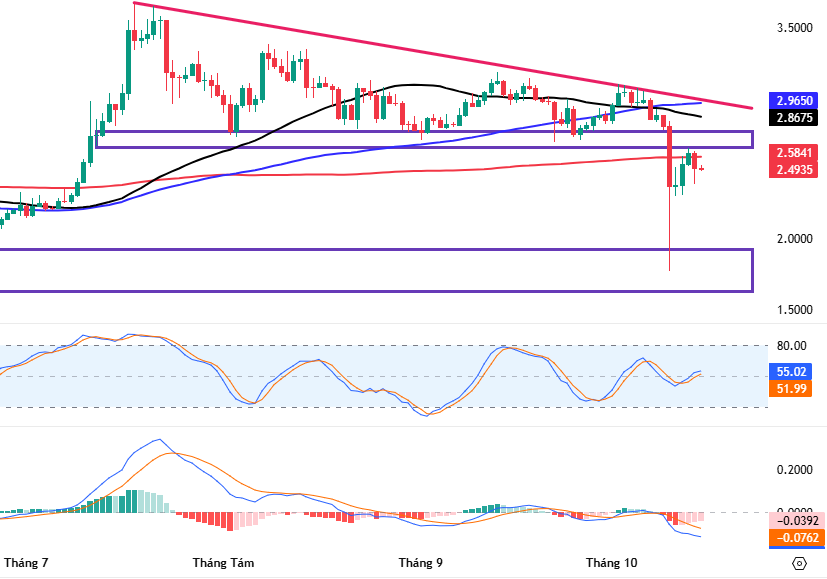
XRP Chart (2025) – Source: TradingView
In summary, XRP is expected to trade sideways in the medium term within the $1.36–$3.35 USD range. The short-term bearish trend is likely to persist unless technical signals improve, with the April 2025 lows acting as critical support.
SOL: Short-Term Recovery Emerges
On the weekly chart, SOL continues to hover around the middle band of the Bollinger Bands, while the ADX remains below 20, indicating a weak medium-term trend and prolonged sideways movement.
Currently, SOL finds support at the lower boundary ($174–$191 USD) of its medium-term Bullish Price Channel. However, the MACD is narrowing toward the signal line, and a sell signal could increase the risk of breaking below this support level.
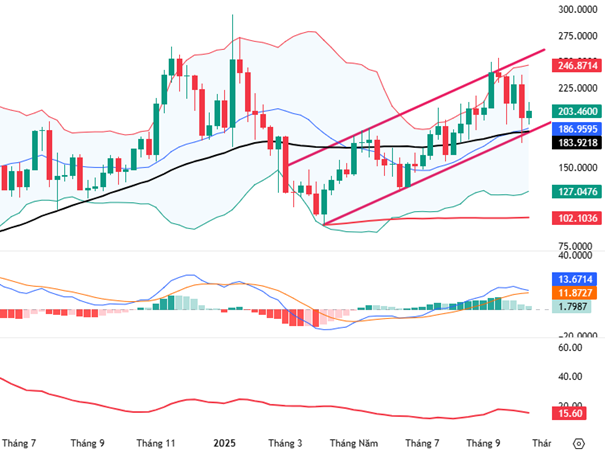
SOL Chart (2024–2025) – Source: TradingView
On the daily chart, SOL maintains a short-term recovery after retesting the 200-day SMA. The Stochastic Oscillator has issued a buy signal and continues to rise, reducing immediate downside risks.
However, SOL remains below the middle band of the Bollinger Bands, and the MACD persists in bearish territory below zero. If the recovery falters and signals deteriorate, a bearish scenario could reemerge.
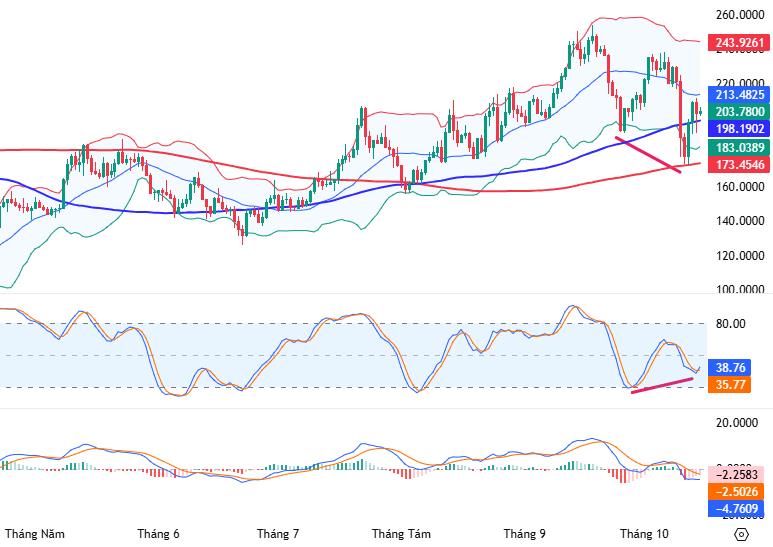
SOL Chart (2025) – Source: TradingView
In conclusion, SOL’s technical outlook suggests ongoing challenges. Investors should limit trading in this range and await stronger positive signals before re-entering.
Technical Analysis Team, Vietstock Advisory Department
– 13:20 15/10/2025
Afternoon Technical Analysis, October 13: Soaring to New Heights

The VN-Index has continued its upward trajectory, reaching an all-time high. With the previous peak from September 2025 (around 1,700–1,711 points) now decisively broken, this level shifts from resistance to a robust support zone. Meanwhile, the HNX-Index has rebounded, testing the Middle line of the Bollinger Bands.
Technical Analysis Afternoon Session 09/10: Anticipating a Break Above Previous Highs

The VN-Index continues its upward trajectory, with expectations high that it will surpass its previous peak from September 2025 (equivalent to the 1,700-1,711 point range). This optimism is fueled by the emergence of buy signals from both the MACD and Stochastic Oscillator indicators. In contrast, the HNX-Index currently trades below the Middle line of the Bollinger Bands.
Afternoon Technical Analysis October 8: Continued Tug-of-War

The VN-Index remains in a tug-of-war as it retests the September 2025 peak (around 1,700-1,711 points). Meanwhile, the HNX-Index hovers near the Middle line of the Bollinger Bands.
Gold Ring and Gold Bar Prices Surge Again on October 7th

The surge in domestic gold prices shows no signs of abating, with gold bars reaching a staggering 140.6 million VND per tael, while gold rings are trading at 138.3 million VND per tael.
Technical Analysis for the Afternoon Session of October 7th: Re-testing the September 2025 Peak

The VN-Index is currently retesting its September 2025 peak (around 1,700-1,711 points). The outcome of this test will determine the short-term trend. Meanwhile, the HNX-Index is also retesting the Middle Bollinger Band, leading to intense volatility.


