


 Reports 70% Surge in Q3 Profits, Partners with Energy Giant in Oil & Gas Sector")


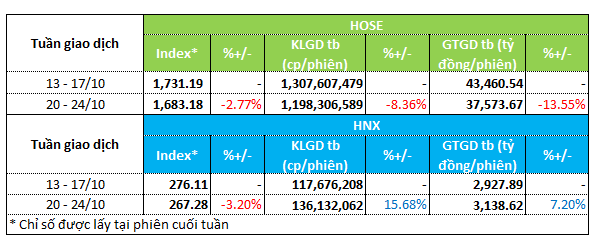
The market experienced a downward trend during the week of October 20-24, heavily influenced by the initial session on October 20, where the VN-Index dropped by nearly 95 points and the HNX-Index fell by over 13 points. By the end of the week, the VN-Index closed at 1,683.18 points, a decrease of nearly 3%, while the HNX-Index ended at 267.28 points, down by 3.2%.
Trading activity on the HOSE slowed after two active weeks. The average trading volume decreased by 8% to approximately 1.2 billion units per session, and the average trading value dropped by nearly 14% to 37.6 trillion VND per session.
In contrast, the HNX continued to see positive liquidity trends. The average trading volume reached 136 million units per session, a 16% increase from the previous week. The average trading value exceeded 3.1 trillion VND per session, up by 7%.
|
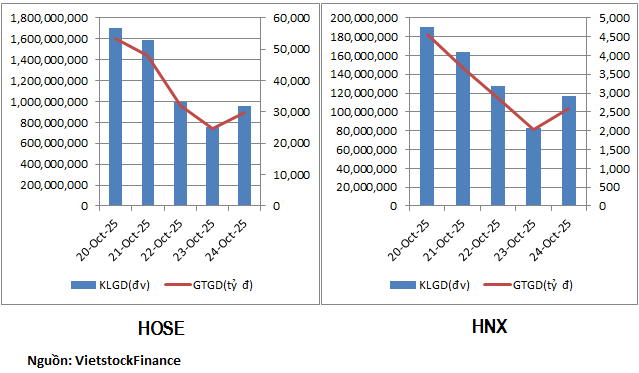
Market Liquidity Overview for the Week of October 20-24
|
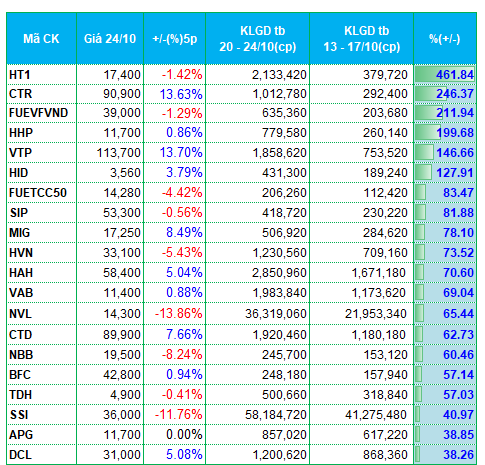
Last week, liquidity was notably strong in the construction sector. The top performers in terms of increased liquidity on both exchanges featured several construction stocks. HT1 stood out with a trading volume surge of over 460% compared to the previous week, reaching 2.1 million units per session. CTR also saw a significant increase of nearly 250%, exceeding 1 million units per session.
On the HNX, VC2 recorded a rise of more than 140%, reaching 665 thousand units per session.
Additionally, several construction-related stocks such as CTD, MST, LIG, and S99 were among those with increased liquidity.
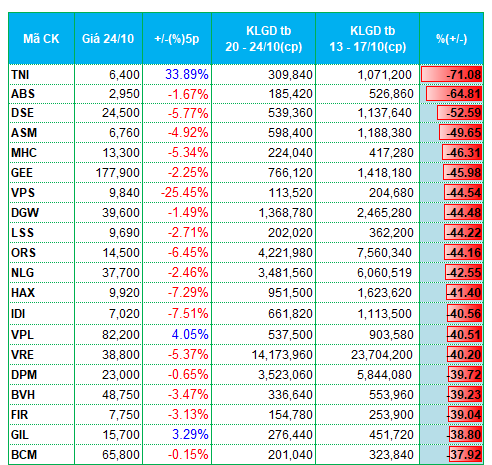
Many sectors experienced mixed liquidity trends. Notably, the real estate sector saw both increases and decreases. Stocks like TIG, CEO, API, VC3, SIP, NVL, and TDH experienced higher liquidity, while others such as NLG, VRE, FIR, BCM, NDN, DTD, NRC, IDC, and IDJ saw declines.
Similarly, the securities sector exhibited mixed trends. Stocks like SSI, APG, and PSI saw increased liquidity, whereas ORS, DSE, EVS, VIG, IVS, and MBS experienced outflows.
|
Top 20 Stocks with Highest Liquidity Increase/Decrease on HOSE
|
|
Top 20 Stocks with Highest Liquidity Increase/Decrease on HNX
|
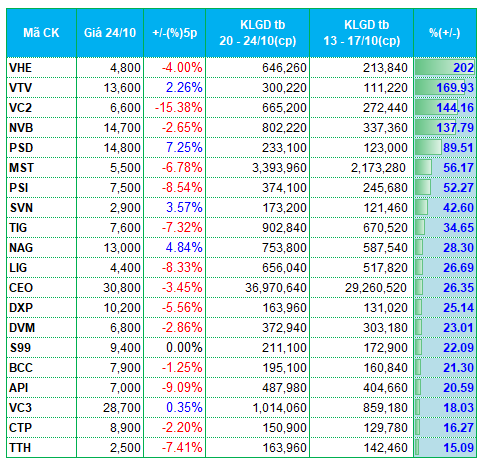
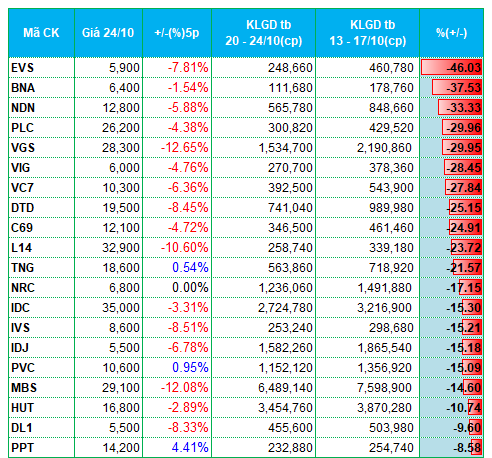
The list of stocks with the highest increases and decreases in liquidity is based on average trading volumes exceeding 100,000 units per session.
– 19:28 27/10/2025
Market Pulse 27/10: Real Estate Stocks Plunge, VN-Index Sheds Over 30 Points

At the close of trading, the VN-Index fell by 30.64 points (-1.82%), settling at 1,652.54 points, while the HNX-Index dropped 1.92 points (-0.72%), closing at 265.36 points. Market breadth was predominantly bearish, with 536 decliners outpacing 125 advancers. Similarly, the VN30 basket saw red dominate, as 24 stocks declined, 5 advanced, and 1 remained unchanged.
Expert Insights: Anticipate Market Volatility Before the Next Wave – Seize Opportunities to Target High-Potential Stocks in Q4

Amidst a market undergoing a corrective phase marked by diminished liquidity, reflecting investors’ current cautious sentiment, sectors underpinned by fundamental strengths such as profit growth are poised to catalyze an early resurgence of capital inflows.
Vietstock Weekly 27-31/10/2025: Will Market Volatility Persist?

The VN-Index extended its correction into the second consecutive week, accompanied by trading volumes dipping below the 20-session average. While the decline has somewhat narrowed, a cautious sentiment persists, with demand largely exploratory and lacking the breadth required for a sustained rebound. Against a backdrop where the Stochastic Oscillator has signaled a sell and the MACD is gradually converging with the Signal Line, continued volatility is likely in the near term.
Market Outlook for Warrants in Week 27-31/10/2025: A Mixed Trading Landscape

As the trading session closed on October 24, 2025, the market witnessed a mixed performance with 77 stocks advancing, 140 declining, and 37 remaining unchanged. Foreign investors continued their net selling streak, offloading a total of over 991 million VND.
Foreign Blockades Unleash Massive Sell-Off: Net Outflow of VND 4.7 Trillion in Week 20-24/10, Contrasting Billion-Dollar Bluechip Buy-In

The record-breaking session on October 21st surprisingly saw net buying from foreign investors, but selling pressure swiftly returned with intensity in the subsequent trading days.


