I. Market Analysis of the Base Stock Market on October 27, 2025
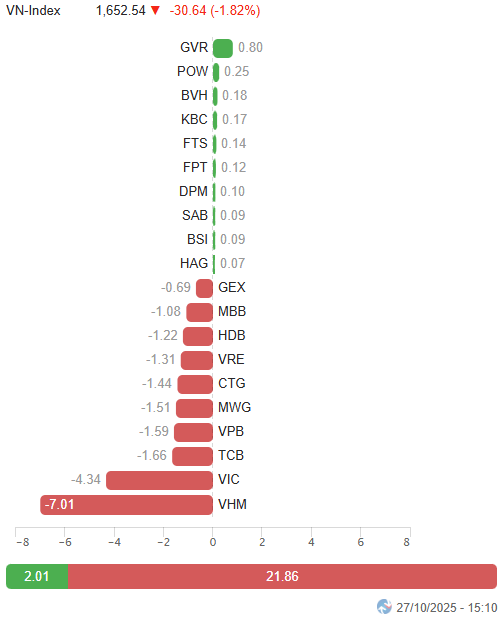
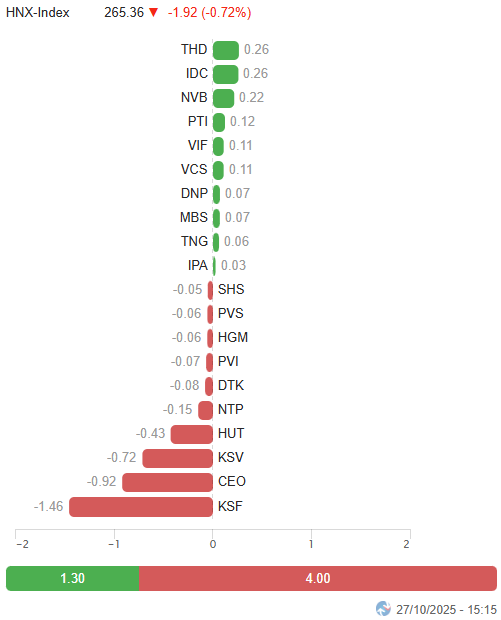
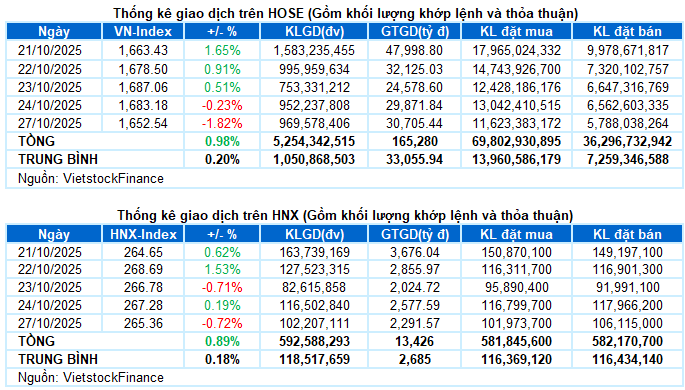
On October 27, major indices experienced a sharp decline. Specifically, the VN-Index dropped by 1.82%, closing at 1,652.54 points, while the HNX-Index fell by 0.72%, ending at 265.36 points.
Trading volume on the HOSE decreased slightly by 1.4%, reaching over 903 million units. The HNX recorded more than 91 million matched units, a 12.5% decline compared to the previous session.
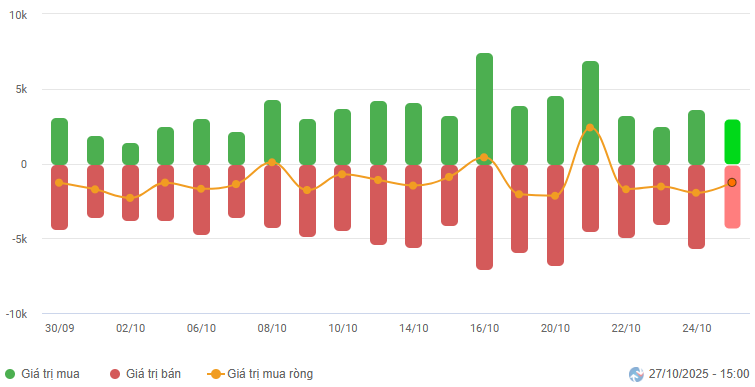
Foreign investors continued to net sell, with a value of nearly VND 1.2 trillion on the HOSE and nearly VND 79 billion on the HNX.
Foreign Investors’ Trading Value on HOSE, HNX, and UPCOM by Date. Unit: Billion VND
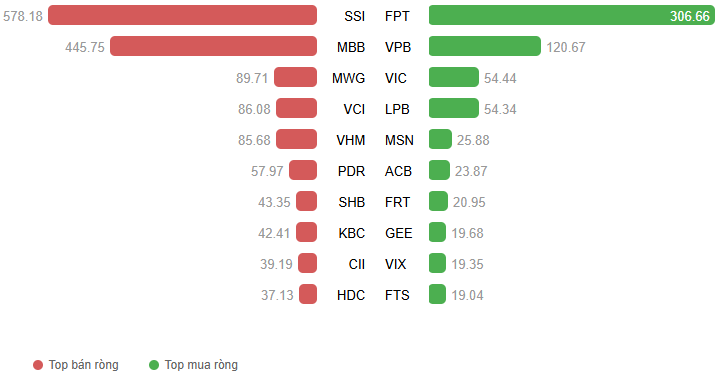
Net Trading Value by Stock Code. Unit: Billion VND
The session on October 27 started positively, with the VN-Index approaching the 1,700-point mark at the opening. However, early profit-taking pressure caused the index to reverse quickly. Despite recovery efforts around the 1,665-point level, investor sentiment remained cautious, leading to a prolonged tug-of-war. The situation worsened in the final minutes as selling pressure intensified among blue-chip stocks, spreading negativity across the market. The VN-Index closed at 1,652.54 points, down 1.82% from the previous session.
Among the top influencers, the 10 most negatively impacting stocks collectively deducted nearly 22 points from the VN-Index, led by VHM and VIC. In contrast, the 10 most positively contributing stocks could only add 2 points to the index, highlighting the overwhelming selling pressure.
Top Stocks Influencing the Index. Unit: Points
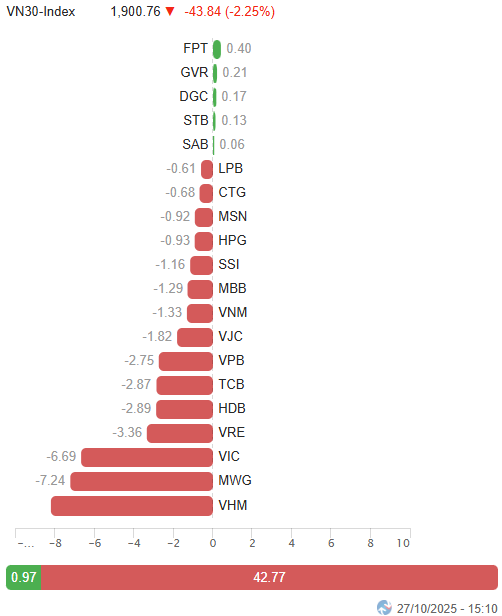
The VN30-Index lost 43.84 points (-2.25%), closing at 1,900.76 points. The basket’s breadth favored sellers, with 24 decliners, 5 gainers, and 1 unchanged stock. Notably, VRE and VHM hit the lower limit, while MWG, HDB, SSI, and VPB dropped over 3%. On the positive side, GVR stood out with a 3.2% gain.
Sector-wise, real estate was the worst performer, plunging 3.59%. Vingroup’s trio faced heavy adjustments, and other stocks like CEO, DIG, PDR, NVL, DXG, KDH, TCH, SJS, HDC, and NLG also saw significant selling pressure.
Financial and industrial sectors further weighed on the index, falling 1.46% and 0.84%, respectively. Stocks like SSI, HDB, MBB, VPB, TCB, CTG, VJC, VSC, HAH, CTD, DPG, BMP, GEX, and CII declined sharply.
In contrast, information technology led the market, driven by FPT (+0.31%), CMG (+1.94%), ELC (+0.71%), VEC, and SMT, which hit their upper limits.
Additionally, stocks sensitive to tariff news gained traction following Vietnam and the U.S.’s Joint Statement on the Trade Agreement Framework. Notable performers included VGT (+6.19%), MSH (+4.37%), TCM (+2.5%), TNG (+4.3%), VGG (+4.76%), HTG (+2.43%) in textiles; VHC (+1.84%), IDI (+2.14%), MPC (+3.73%), ASM (+1.18%), FMC (+1.14%) in seafood; and KBC (+2.23%), IDC (+3.14%), SIP (+2.25%), SZC (+1.35%), LHG (+1.87%) in industrial real estate.
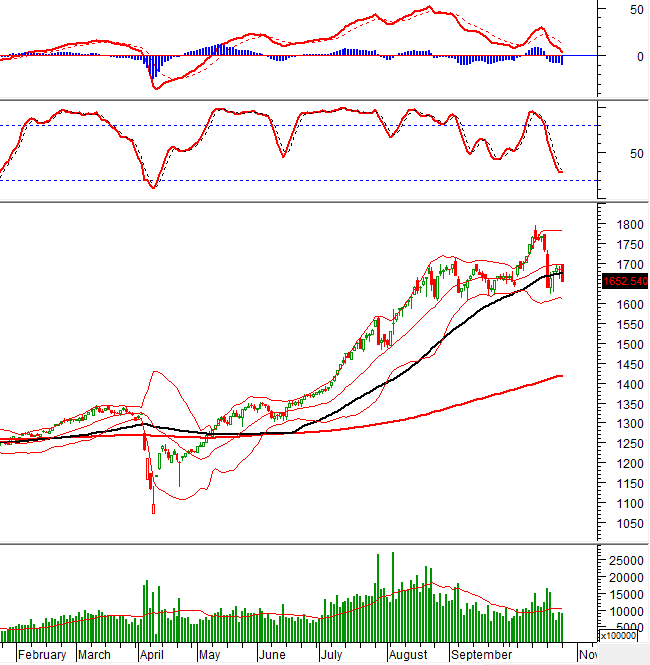
The VN-Index reversed sharply after failing to test the Bollinger Bands’ Middle line. A Big Black Candle pattern emerged, with trading volume below the 20-session average. The MACD indicator weakened further after a sell signal, approaching the zero line, indicating significant short-term correction risks.
II. Price Trend and Volatility Analysis
VN-Index – MACD Weakens Further, Approaching Zero
The VN-Index reversed sharply after failing to test the Bollinger Bands’ Middle line. A Big Black Candle pattern emerged, with trading volume below the 20-session average.
The MACD indicator weakened further after a sell signal, approaching the zero line, indicating significant short-term correction risks.
The August 2025 low (around 1,605-1,630 points) remains a critical support level for the index.
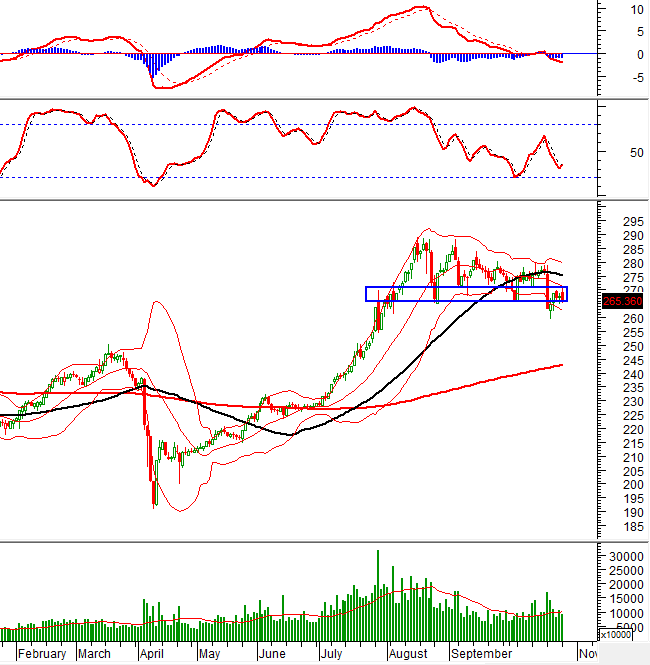
HNX-Index – Alternating Gains and Losses with Fluctuating Volume
The HNX-Index continues to oscillate around the August 2025 low (265-270 points). Recent alternating gains and losses with fluctuating volume reflect investor uncertainty.
Currently, the MACD remains below zero, and the index stays under the Bollinger Bands’ Middle line, suggesting a weak short-term outlook.
Capital Flow Analysis
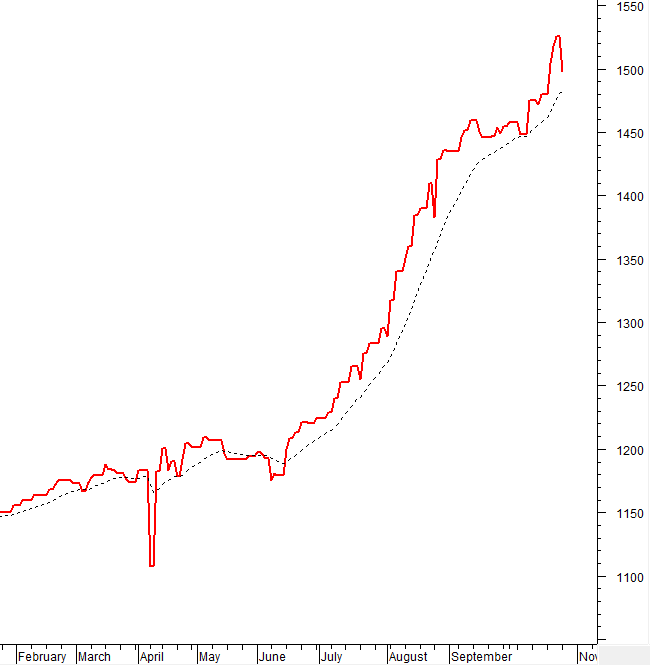
Smart Money Movement: The Negative Volume Index of the VN-Index is above the 20-day EMA. If this continues in the next session, the risk of a sudden downturn (thrust down) will be mitigated.
Foreign Capital Movement: Foreign investors continued to net sell on October 27, 2025. If this trend persists in upcoming sessions, the outlook may become more pessimistic.
III. Market Statistics for October 27, 2025
Economic Analysis & Market Strategy Department, Vietstock Consulting
– 17:11 October 27, 2025
When IPOs Become the Market’s “Litmus Test of Confidence”

Amidst the fluctuations of the VN-Index, the 2025 IPO wave continues to surge, bringing a host of major enterprises to the market. The success of multi-billion-dollar deals underscores the inherent strength of Vietnam’s capital market and reinforces expectations for a sustainable growth phase.
Technical Analysis Afternoon Session 27/10: Testing the Middle Line of Bollinger Bands

The VN-Index experienced intense volatility as it retested the Middle line of the Bollinger Bands. The outcome of this critical test will shape the index’s trajectory in the coming period. Meanwhile, the HNX-Index saw modest gains, forming a High Wave Candle pattern.
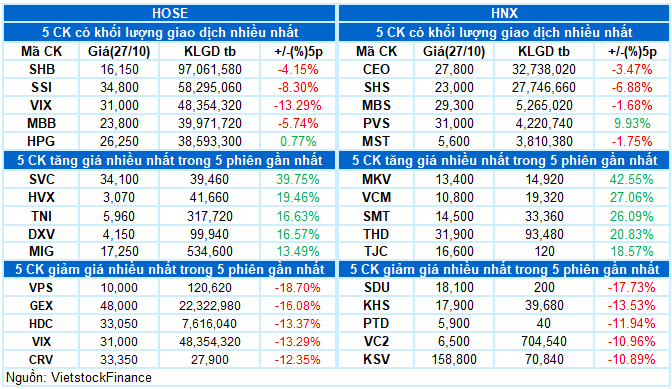
Construction Stocks See a Week of Inflowing Capital

In the week of October 20-24, cash flow dynamics diverged sharply across the two listed markets. One standout group demonstrated remarkable liquidity growth, with multiple representatives experiencing multi-fold increases in trading volume.
Market Pulse 27/10: Real Estate Stocks Plunge, VN-Index Sheds Over 30 Points

At the close of trading, the VN-Index fell by 30.64 points (-1.82%), settling at 1,652.54 points, while the HNX-Index dropped 1.92 points (-0.72%), closing at 265.36 points. Market breadth was predominantly bearish, with 536 decliners outpacing 125 advancers. Similarly, the VN30 basket saw red dominate, as 24 stocks declined, 5 advanced, and 1 remained unchanged.
Is Vietnam’s Stock Market a Viable Long-Term Investment Opportunity?

With a multitude of positive catalysts, including macroeconomic stability, promising profit prospects for listed companies, and the regulatory body’s commitment to developing a transparent and sustainable stock market, Vietnam’s stock market holds immense long-term potential.


