


Vietnam’s stock market experienced a turbulent week, marked by significant fluctuations. The VN-Index plummeted by a record-breaking 94 points in the opening session, with over 100 stocks hitting their lower limits. The market rebounded slightly in the subsequent two sessions, hovering around 1,620 points. However, this recovery wasn’t sufficient to propel the index back to the psychological threshold of 1,700 points.
By week’s end, the VN-Index closed at 1,683.18 points, a 2.77% decline. The market breadth favored decliners, reflecting intense profit-taking pressure on sectors that had previously performed well, such as securities, banking, seafood, ports, and construction.
Conversely, investors shifted their focus to stocks that had undergone deep corrections and prolonged accumulation phases, particularly in technology, telecommunications, and retail sectors. Notably, companies with robust Q3 earnings growth attracted significant attention.

Vietnam’s stock market endured a volatile week of trading.
Overall market liquidity improved, with capital continuing to circulate. While speculative stocks faced heavy selling pressure, fundamentally strong stocks with attractive valuations near April-May 2025 support levels witnessed buying interest. Notably, foreign investors extended their net selling streak to 14 consecutive weeks, totaling over VND 4,360 billion on the HoSE.
Analysts from Saigon-Hanoi Securities (SHS) noted that the VN-Index is retesting the 1,700-point resistance zone after rebounding from the 1,620-1,630 support level. The next critical resistance is identified around 1,730 points, corresponding to the peak during the October 20th sell-off.
Influenced by blue-chip stocks and the VN30, the index has entered an accumulation phase following an extended uptrend. Selling pressure is intensifying at higher price levels, particularly for speculative stocks.
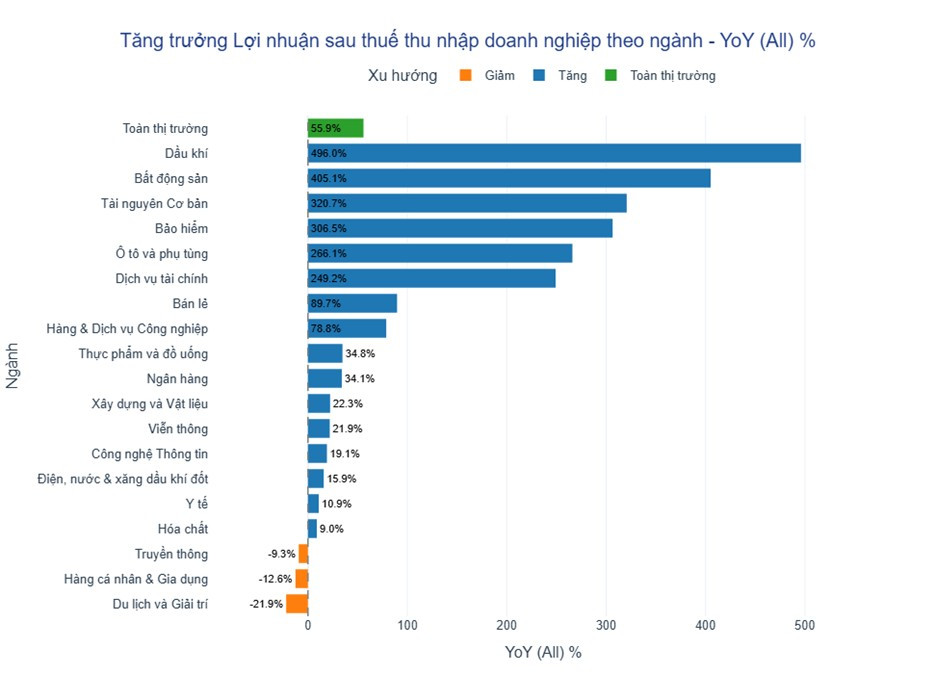
Q3 after-tax profit growth by sector. Source: YSVN.
SHS believes the market’s sharp rally since April 2025 has concluded, ushering in a period of differentiation. Overheated, highly leveraged stocks face significant selling pressure, while capital flows toward fundamentally sound stocks that have undergone prolonged corrections. These stocks are trading at attractive valuations similar to April-May 2025 levels and boast promising Q3 earnings prospects.
“We maintain a cautious stance, seeking new investment opportunities based on reasonable valuations and solid corporate earnings,” the analysts advised.
According to Pinetree Securities experts, the market’s short-term outlook leans positive rather than negative, with a high likelihood of continuing its sideways uptrend within a narrow range. However, a sharp rally is unlikely in the immediate future due to the lack of widespread capital distribution. Early next week, the market may experience a shakeout or mild correction to test buying interest before resuming a more stable upward trajectory.
Regarding margin trading risks, Nguyen The Minh, Director of Retail Analytics at Yuanta Securities Vietnam, highlighted that margin debt reached a new record high in Q3 2025. However, debt growth was only 69.47% year-over-year, lower than the 137% growth rate in Q2 2021.
The margin-to-equity ratio stands at 1.1 times, below the 2.0 times maximum and the historical peak of 1.5 times in 2021. While margin levels are high, they aren’t excessively “hot” compared to historical levels, leaving room for further growth.
Yuanta’s latest update reveals that 589 out of 1,594 companies have released their Q3 financial reports. The oil & gas and real estate sectors led in both revenue and after-tax profit growth.
Vietstock Daily 28/10/2025: Significant Short-Term Risks Loom Large

The VN-Index reversed sharply after failing to breach the middle line of the Bollinger Bands. A prominent Big Black Candle pattern emerged, accompanied by trading volume remaining below the 20-session average. The MACD indicator continued to weaken following its sell signal and is now approaching the zero threshold. This signals a heightened risk of short-term correction.
When IPOs Become the Market’s “Litmus Test of Confidence”

Amidst the fluctuations of the VN-Index, the 2025 IPO wave continues to surge, bringing a host of major enterprises to the market. The success of multi-billion-dollar deals underscores the inherent strength of Vietnam’s capital market and reinforces expectations for a sustainable growth phase.
Technical Analysis Afternoon Session 27/10: Testing the Middle Line of Bollinger Bands

The VN-Index experienced intense volatility as it retested the Middle line of the Bollinger Bands. The outcome of this critical test will shape the index’s trajectory in the coming period. Meanwhile, the HNX-Index saw modest gains, forming a High Wave Candle pattern.
Construction Stocks See a Week of Inflowing Capital

In the week of October 20-24, cash flow dynamics diverged sharply across the two listed markets. One standout group demonstrated remarkable liquidity growth, with multiple representatives experiencing multi-fold increases in trading volume.
Market Pulse 27/10: Real Estate Stocks Plunge, VN-Index Sheds Over 30 Points

At the close of trading, the VN-Index fell by 30.64 points (-1.82%), settling at 1,652.54 points, while the HNX-Index dropped 1.92 points (-0.72%), closing at 265.36 points. Market breadth was predominantly bearish, with 536 decliners outpacing 125 advancers. Similarly, the VN30 basket saw red dominate, as 24 stocks declined, 5 advanced, and 1 remained unchanged.


