


 Projects 2026 Profit Decline, Marking a 5-Year Low")


")


: Mixed Signals Emerge")

: Short-Term Outlook Continues to Deteriorate")
BTC: Short-Term Challenges Persist
On the weekly chart, BTC is retesting the lower edge of its medium-term Bullish Price Channel after struggling to breach the Fibonacci Projection 100% level (equivalent to the $105,700–$111,500 range), as discussed in the October 2025 Crypto Report (Part 1).
Currently, BTC’s price sits below the Bollinger Bands’ Middle line, while the MACD indicator continues to widen its gap from the Signal line, approaching the zero level after issuing a sell signal. This suggests a bearish outlook in the near term. If technical signals remain unchanged, the $93,000–$98,000 range (aligning with the 78.6% Fibonacci Projection) will serve as short-term support for BTC.
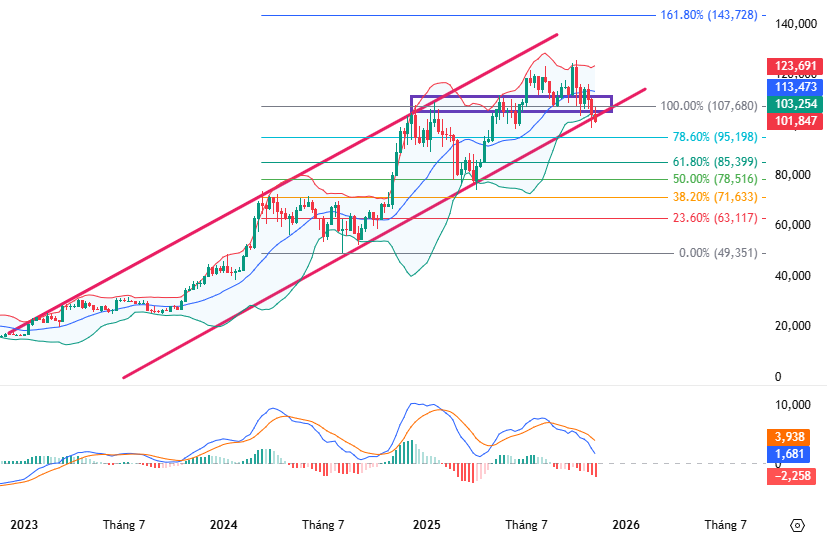
BTC Chart (2023–2025) – Source: TradingView
On the daily chart, BTC is consolidating with alternating bullish and bearish sessions, forming a Falling Wedge pattern after retesting the June 2025 low ($97,000–$101,000 range). The 50-day and 200-day SMAs are converging, and a potential Death Cross could further dampen medium-term sentiment.
In summary, while the long-term uptrend remains intact, short-term downside risks persist. Investors should monitor for stronger recovery signals near the June 2025 lows before making moves.
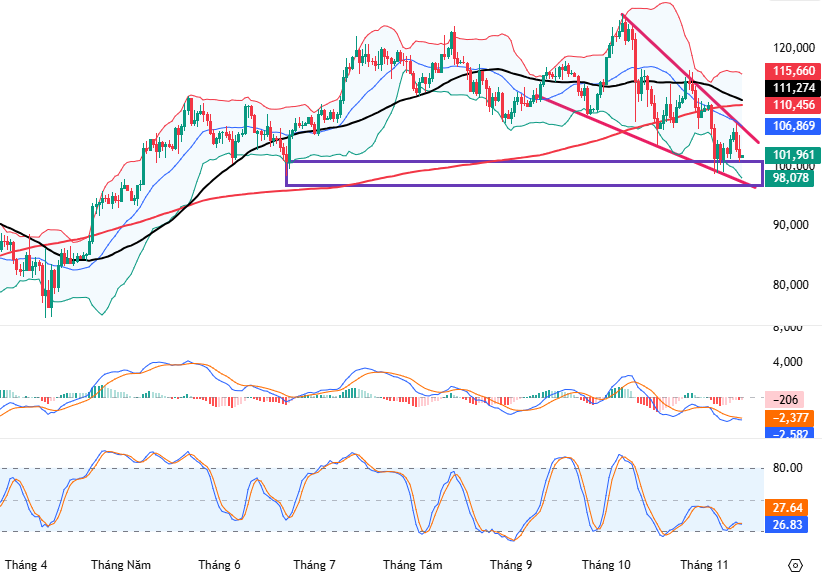
BTC Chart (2025) – Source: TradingView
ETH: False Breakout Emerges
On the weekly chart, ETH failed to reclaim the December 2024 high ($3,900–$4,100 range) and is trading below the Bollinger Bands’ Middle line, indicating a high-reliability false breakout. The Stochastic Oscillator remains weak after a sell signal in overbought territory, while the MACD continues to diverge from the Signal line, amplifying short-term pessimism.
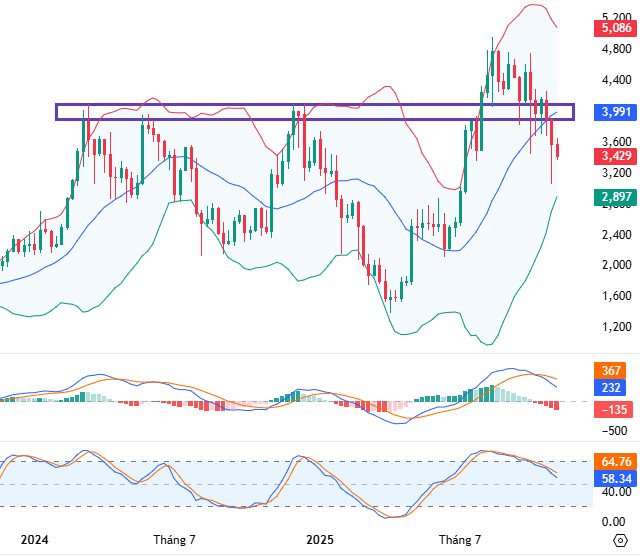
ETH Chart (2024–2025) – Source: TradingView
On the daily chart, ETH staged a short-term pullback after testing the 50% Fibonacci Retracement ($3,000–$3,250 range). However, lower highs and lows persist, with the MACD below zero and issuing sell signals, delaying recovery prospects. The Death Cross between the 50-day and 100-day SMAs, coupled with prices below the Middle line, reinforces bearish sentiment.
In conclusion, ETH exhibits strong bearish signals after losing the $3,900–$4,100 support. Investors should avoid trading in this zone and await potential recovery signals near the June 2025 low ($2,000–$2,300 range) for better entry opportunities.
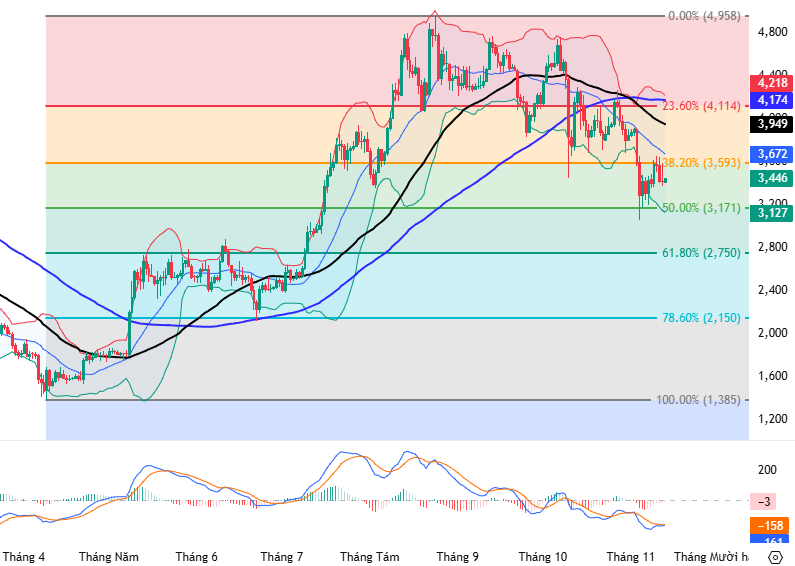
ETH Chart (2025) – Source: TradingView
Technical Analysis Team, Vietstock Advisory Department
– 11:00 14/11/2025
Technical Analysis Afternoon Session 14/11: Preparing to Test the Middle Bollinger Band

The VN-Index remains in a tight tug-of-war, forming a small-bodied candle as it approaches testing the Middle line of the Bollinger Bands. Meanwhile, the HNX-Index shows promising momentum, with both the MACD and Stochastic Oscillator indicators signaling a buy opportunity.
Derivatives Market on November 14, 2025: Mixed Signals Emerge

On November 13, 2025, the VN30 and VN100 futures contracts diverged in their performance. The VN30-Index exhibited a tug-of-war pattern, forming a small-bodied candlestick accompanied by declining trading volume, which remained below the 20-session average. This suggests a cautious sentiment among investors.
Technical Analysis Afternoon Session 13/11: Stochastic Oscillator Signals a Buy Opportunity

The VN-Index staged a modest recovery, forming a small-bodied candle, while the Stochastic Oscillator signaled a return to buying momentum. Meanwhile, the HNX-Index extended its upward trajectory, decisively breaching the Middle line of the Bollinger Bands.
Derivatives Market Outlook on November 13, 2025: Has Pessimism Subsided?

On November 12, 2025, both the VN30 and VN100 futures contracts rallied during the trading session. The VN30-Index extended its winning streak to a second consecutive session, forming a White Marubozu candlestick pattern. This bullish signal was further reinforced by a notable increase in trading volume compared to the previous session, indicating a shift in investor sentiment from pessimism to cautious optimism.
Afternoon Technical Analysis, November 12: Cautious Sentiment Persists

The VN-Index and HNX-Index experienced a modest recovery, marked by small-bodied candles and subdued trading volumes in the morning session, indicating investor caution.


