


: Returning to Critical Support Levels?")


: A Wave of Negativity Sweeps In")
XRP: Heightened Risk of Revisiting April 2025 Lows
On the weekly chart, XRP continues its short-term downtrend after failing to reclaim the 50-week SMA and is now testing the lower band of the Bollinger Bands.
Additionally, the MACD indicator has weakened further, crossing below the zero line after issuing a sell signal, amplifying short-term pessimism.
Meanwhile, the ADX indicator shows signs of recovery, hovering in the grey zone (20 < ADX < 25).
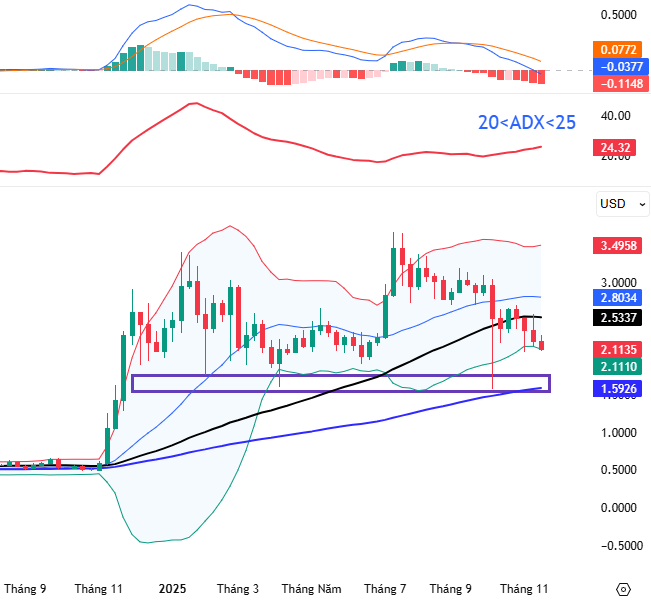
XRP Chart (2024 – 2025) – Source: TradingView
As mentioned in the October 2025 Crypto Report (Part 2), on the daily chart, after a pullback to retest the lower boundary (around $2.65-$2.75) of the broken Descending Triangle, the death cross between the 50-day SMA and 200-day SMA in early November 2025 reinforced a bearish mid-term outlook.
Furthermore, the MACD remains below the zero line with a sell signal, while XRP’s price stays below the Bollinger Bands’ middle line, indicating continued downside risk.
In summary, XRP is expected to maintain its downward trajectory unless technical signals improve. The April 2025 lows will remain a critical support level for investors seeking safer entry points upon stronger recovery signals.
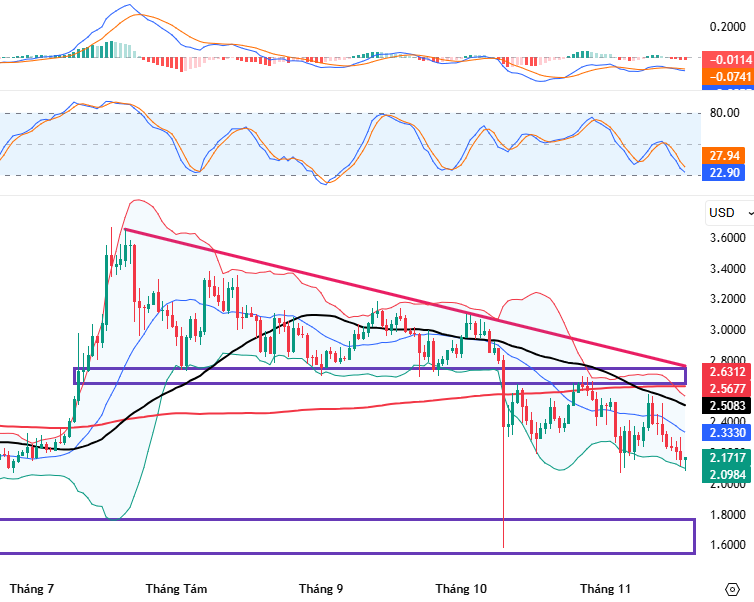
XRP Chart (2025) – Source: TradingView
SOL: Confirmed Breakdown of Bullish Price Channel
As anticipated in the October 2025 Crypto Report (Part 2), SOL’s weekly chart confirms a bearish scenario with the breakdown of its mid-term bullish price channel (lower boundary at $174-$191).
Currently, SOL hovers near the Bollinger Bands’ lower band, retesting the June 2025 lows ($125-$137). The MACD has widened its gap below the signal line and crossed the zero line after a sell signal, suggesting a bleak short-term outlook.
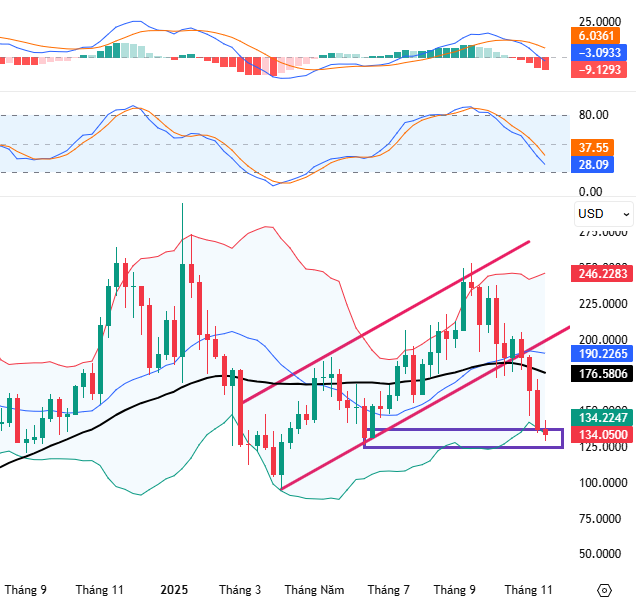
SOL Chart (2024 – 2025) – Source: TradingView
On the daily chart, SOL’s steep decline persists following the death cross between the 50-day SMA and 100-day SMA in early November 2025.
The price remains near the Bollinger Bands’ lower band, while the MACD shows lower highs and lower lows. If the $125-$137 support is breached, the likelihood of retesting the April 2025 lows ($95-$108), also the 52-week bottom, will increase significantly.
In conclusion, SOL faces substantial technical challenges ahead. Investors should avoid active trading at current levels and await more positive signals.
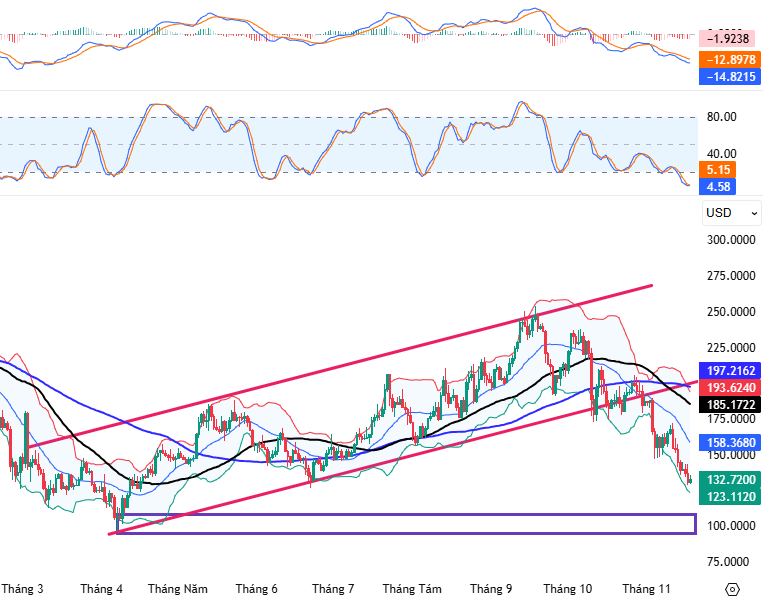
SOL Chart (2025) – Source: TradingView
Technical Analysis Team, Vietstock Advisory Department
– 09:35 19/11/2025
Derivatives Market on November 19, 2025: Investors Maintain Optimistic Outlook

On November 18, 2025, both VN30 and VN100 futures contracts surged during the trading session. The VN30-Index continued its upward trajectory, forming a near-perfect Hammer candlestick pattern, indicating a bullish sentiment among investors.
Technical Analysis for the Afternoon Session on November 18th: Entering the Third Consecutive Bullish Session

The VN-Index extended its winning streak to a third consecutive session, decisively breaching the Bollinger Bands’ Middle line. This level is poised to act as a key support in the near term. Meanwhile, the HNX-Index paused its upward momentum, forming an Inverted Hammer pattern.
VN-Index Rebounds with Caution: Prioritize Portfolio Management Over Bottom-Fishing

The VN-Index rebounded above 1,600 points, yet its trend remains unconfirmed. Experts advise investors to hold off on portfolio adjustments until the index surpasses 1,650 and liquidity shows significant improvement.
Derivatives Market Outlook for November 18, 2025: Short-Term Prospects Continue to Improve

On November 17, 2025, both the VN30 and VN100 futures contracts surged during the trading session. The VN30-Index continued its upward trajectory, forming a small-bodied candlestick pattern. However, trading volume remained below the 20-session average, indicating investor hesitation and uncertainty in the market.
Technical Analysis for the Afternoon Session of November 17: Maintaining a Positive Outlook

The VN-Index continues its upward trajectory, decisively breaking above the Bollinger Bands’ Middle line. Meanwhile, the HNX-Index demonstrates even greater momentum, extending its winning streak to a fifth consecutive session.


