


: Mixed Signals Emerge")

: Short-Term Outlook Continues to Deteriorate")
I. MARKET ANALYSIS OF THE UNDERLYING STOCK MARKET ON NOVEMBER 25, 2025
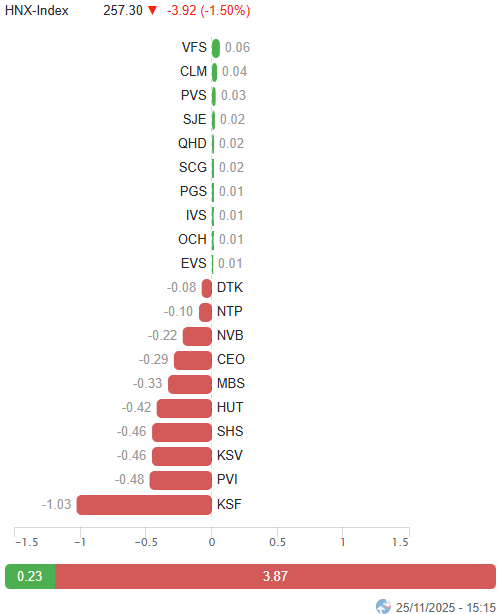
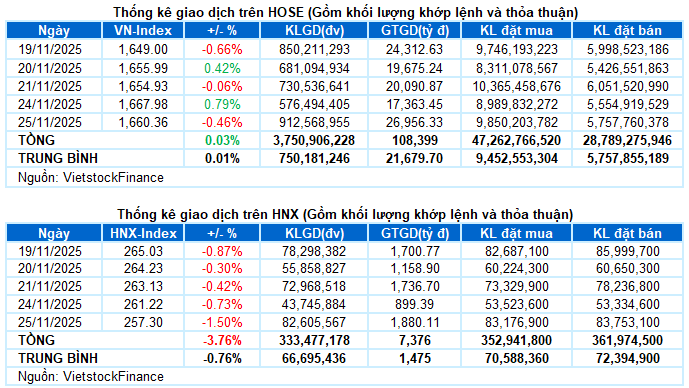
– Major indices universally declined during the November 25 trading session. The VN-Index dropped by 0.46%, closing at 1,660.36 points, while the HNX-Index fell by 1.5%, settling at 257.3 points.
– Trading volume on the HOSE surged by 49% compared to the previous session’s low, reaching 778 million units. Similarly, the HNX recorded over 72 million matched units, a remarkable 76.4% increase.
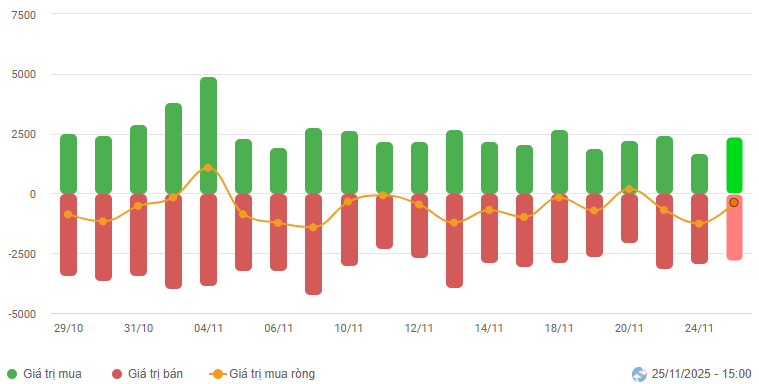
– Foreign investors continued their net selling trend, with a value exceeding 337 billion VND on the HOSE, but turned to net buying on the HNX, amounting to nearly 11 billion VND.
Foreign Investors’ Trading Value on HOSE, HNX, and UPCOM by Date. Unit: Billion VND
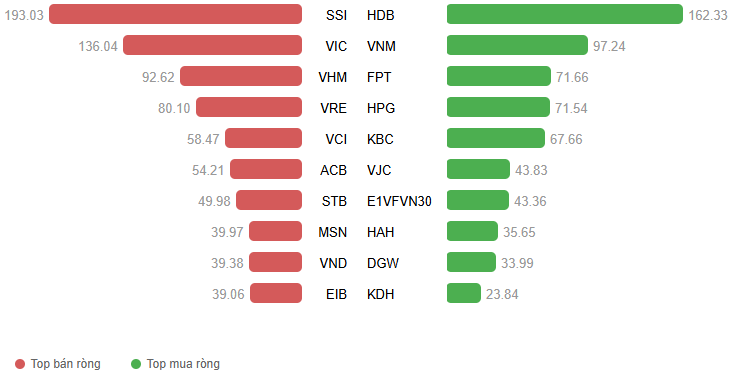
Net Trading Value by Stock Code. Unit: Billion VND
– The VN-Index opened the November 25 session in a “green shell, red core” state, with the index buoyed by a few pillar stocks, while the broader market was dominated by red. The index’s rise, primarily driven by these pillars, led to growing impatience among investors, resulting in increased proactive selling pressure across the board. Efforts to keep the VN-Index above the reference level persisted until mid-afternoon, but the market lacked the breadth to sustain a recovery. Strong fluctuations emerged towards the end of the session as selling pressure intensified, pushing the index downward. The VN-Index closed with a 7.62-point decline, ending at 1,660.36 points.
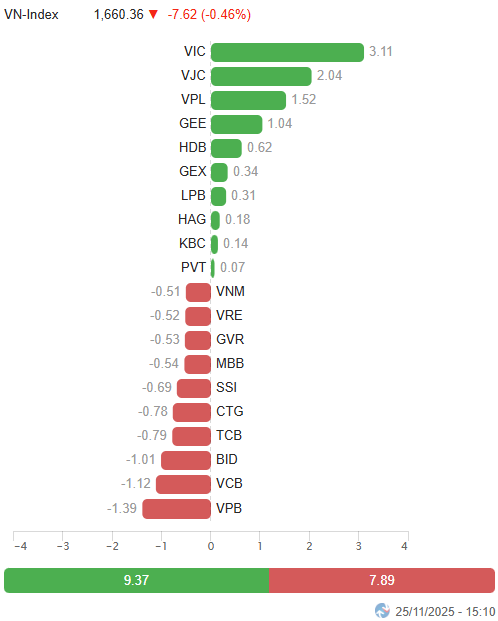
– In terms of influence, VIC remained the leading driver, contributing over 3 points to the VN-Index. Following closely were VJC, VPL, and GEE, adding a combined 4.6 points. Conversely, VPB, VCB, and BID faced significant selling pressure, subtracting 3.5 points from the overall index.
Top Stocks Influencing the Index. Unit: Points
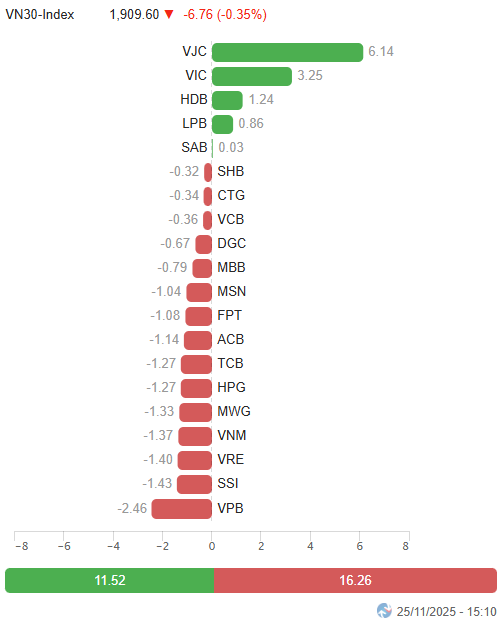
– The VN30-Index closed with a 0.35% decrease, settling at 1,909.6 points. The basket’s breadth favored sellers, with 24 declining stocks, 5 advancing stocks, and 1 unchanged stock. Notably, SSI led the decline with a steep 4.5% drop, followed by VRE, VPB, GVR, and DGC, all losing over 2%. In contrast, VJC stood out with a vibrant purple performance, alongside HDB and VIC, which bucked the trend with notable gains of 2.3% and 1.5%, respectively.
Red dominated most sectors. The communication services sector faced the most significant pressure, with major stocks like VGI (-3.72%), CTR (-2.71%), YEG (-1.92%), TTN (-3.3%), and ICT (-6.34%) undergoing deep corrections.
The financial and materials sectors shared a similar fate, with widespread red across the board. Numerous stocks plummeted by over 2%, including SSI, VIX, VPB, EIB, VND, BVH, VCI, PVI, SHS, MBS, ABB; GVR, DGC, KSB, HT1, DDV, and CSV.
Meanwhile, the consumer discretionary sector bucked the trend with a 0.86% increase, primarily driven by VPL (+4.62%), FRT (+1.14%), and PET (+1.13%). Most others faced strong profit-taking pressure, notably MWG (-1.01%), HUT (-4.09%), TCM (-1.23%), TNG (-2.05%), VGT (-2.36%), HHS (-2.42%), and MSH (-2.23%). Similarly, the industrial and real estate sectors maintained a weak green, primarily supported by VJC, GEE, and PAC hitting their ceilings, GEX (+3.68%), VIC (+1.46%), and KBC (+1.86%).
The VN-Index‘s reversal after testing the SMA 50-day line indicates that selling pressure remains dominant as the index approaches a critical resistance level. The Stochastic Oscillator shows signs of weakening; if sell signals re-emerge and the index continues to close below the SMA 50-day line in upcoming sessions, the risk of returning to a corrective phase is substantial.
II. PRICE TREND AND VOLATILITY ANALYSIS
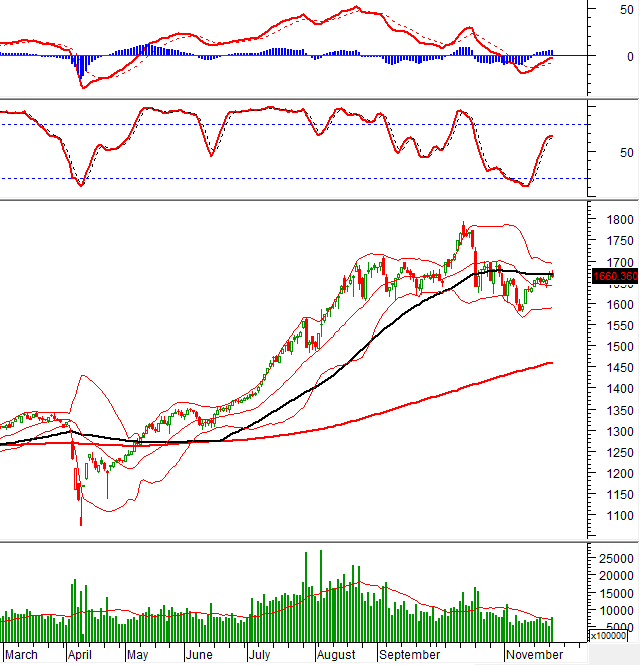
VN-Index – Unable to Breach the SMA 50-Day Resistance
The VN-Index‘s reversal after testing the SMA 50-day line indicates that selling pressure remains dominant as the index approaches a critical resistance level.
The Stochastic Oscillator shows signs of weakening; if sell signals re-emerge and the index continues to close below the SMA 50-day line in upcoming sessions, the risk of returning to a corrective phase is substantial.
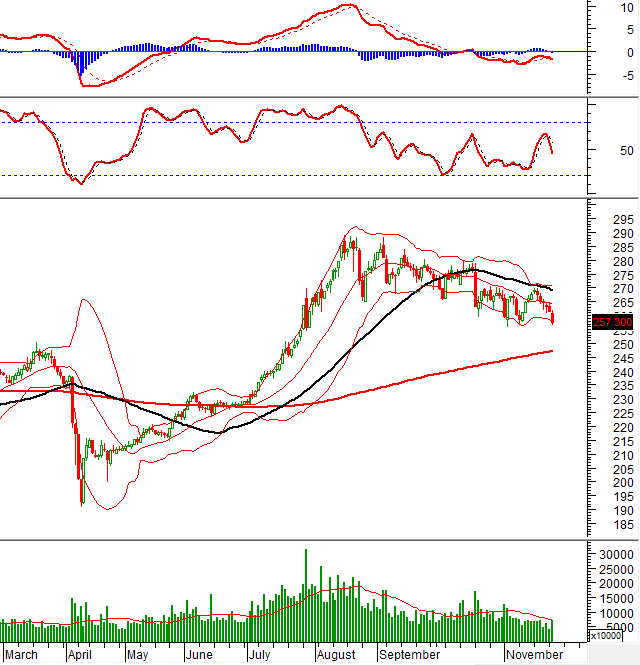
HNX-Index – Touching the Lower Band of Bollinger Bands
The HNX-Index extended its losing streak to six consecutive sessions, touching the lower band of the Bollinger Bands.
Short-term risks are escalating as the Stochastic Oscillator continues its downward trajectory after issuing a sell signal, while the MACD has crossed below the Signal line, reinforcing this bearish indication.
Capital Flow Analysis
Smart Money Flow Dynamics: The Negative Volume Index of the VN-Index remains above the EMA 20-day line. If this condition persists in the next session, the risk of a sudden downward thrust will be mitigated.
Foreign Capital Flow Dynamics: Foreign investors continued their net selling on November 25, 2025. If this trend persists in upcoming sessions, the outlook will become increasingly pessimistic.
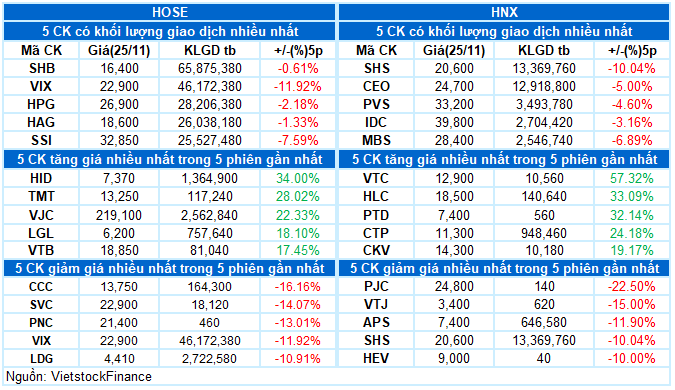
III. MARKET STATISTICS FOR NOVEMBER 25, 2025
Economic Analysis & Market Strategy Division, Vietstock Advisory Department
– 17:18 November 25, 2025
Afternoon Technical Analysis, November 25: Consistently Low Trading Volume

The VN-Index is experiencing modest growth, fluctuating around its 50-day SMA, while trading volumes remain consistently low. Meanwhile, the HNX-Index has entered its sixth consecutive losing session, with the MACD indicator signaling a renewed sell-off.
Foreign Blockades Unleash Massive Sell-Off: Over 1.2 Trillion VND Dumped in Week’s Opening Session – Which Stocks Took the Hardest Hit?

In the afternoon trading session, foreign investors aggressively accumulated FPT shares, with the total value reaching approximately 157 billion VND.
“Brokerage Firms’ Proprietary Trading Arms Invest Nearly $17 Million in Vietnamese Stocks on Monday: Which Stocks Were Most Sought After?”

Proprietary trading desks at Vietnamese securities firms collectively executed a net buy of VND 364 billion on the Ho Chi Minh Stock Exchange (HOSE) during the referenced period.
Pham Nhat Vuong Closes in on the Top 100 World Billionaires List

The Vingroup stock cluster continues to soar to new heights, propelling the VN-Index upward despite intense market polarization. In a single day, Pham Nhat Vuong’s wealth surged by $784 million, edging him closer to joining the ranks of the world’s 100 wealthiest individuals.
Week 24-28/11/2025: Top 10 Hot Stocks Through Vietstock’s Technical Analysis Lens

Uncover the hottest stocks in the market with Vietstock Advisory’s exclusive report. Dive into in-depth analyses of top performers: AGG, DPM, HDB, KHG, NLG, MWG, SSB, TPB, VCB, and VJC. Stay ahead of the curve and make informed investment decisions with expert insights tailored for savvy investors.


