


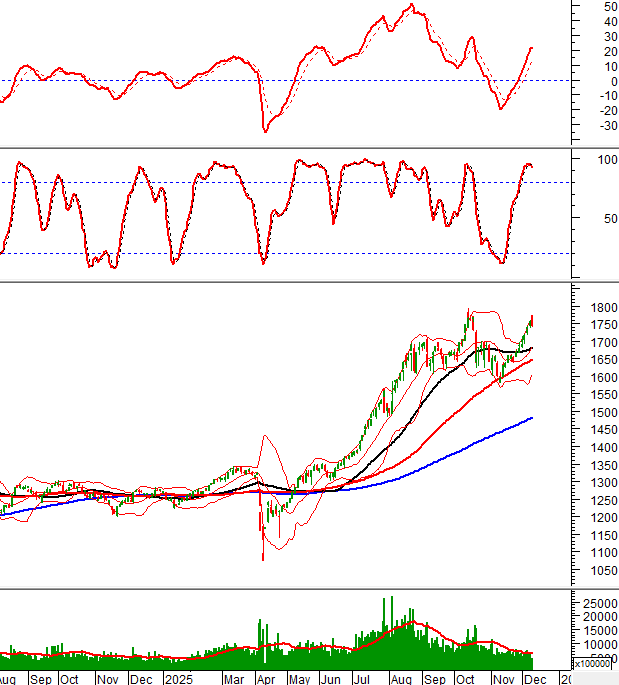
Technical Signals of VN-Index
During the morning trading session on December 9, 2025, the VN-Index experienced significant volatility as it retested the previous peak from October 2025 (equivalent to the 1,760-1,795 point range).
The Stochastic Oscillator reversed and issued a strong sell signal in the overbought zone, increasing short-term risks.
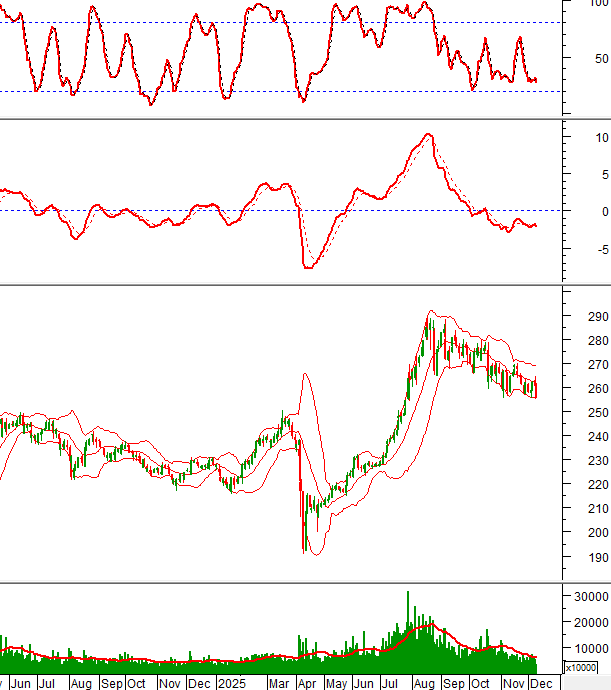
Technical Signals of HNX-Index
During the morning trading session on December 9, 2025, the HNX-Index continued its decline, marking the third consecutive adjustment session.
The previous low from November 2025 is being retested. The outcome of this test will determine the trend moving forward. Investors should exercise caution in the short term, as the index is currently below the Middle Bollinger Band.
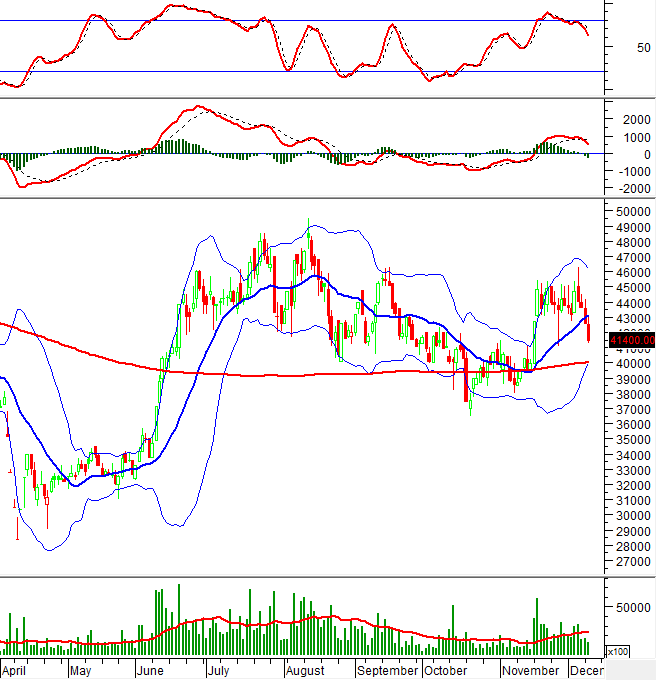
DGW – Digital World Joint Stock Company
During the morning trading session on December 9, 2025, the DGW stock price fell for the fourth consecutive session, reflecting persistent investor pessimism.
Currently, the DGW price has dropped below the Middle Bollinger Band, while the Stochastic Oscillator continues to decline after issuing a sell signal in the overbought zone. This suggests a less favorable short-term outlook.
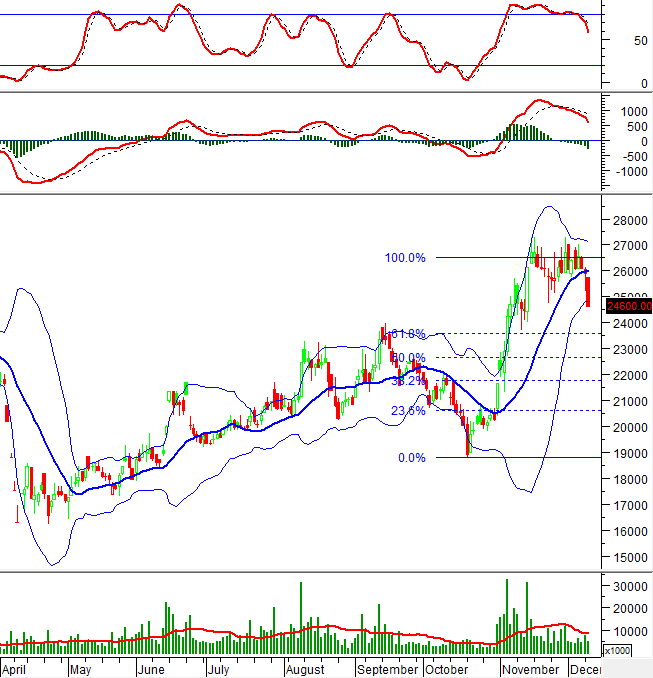
PVD – PetroVietnam Drilling and Drilling Services Corporation
The PVD stock price continued its decline for the third consecutive session during the morning trading on December 9, 2025, accompanied by a Black Marubozu candlestick pattern, indicating lingering investor pessimism.
The PVD price has fallen below the Lower Bollinger Band, while both the MACD and Stochastic Oscillator continue to decline after issuing sell signals, further exacerbating short-term pessimism.
If conditions do not improve and the short-term correction persists in upcoming sessions, the 61.8% Fibonacci Projection level (equivalent to 23,200-23,700) will serve as a support zone for PVD.
(*) Note: The analysis in this article is based on real-time data as of the end of the morning trading session. Therefore, the signals and conclusions are for reference only and may change by the close of the afternoon session.
Technical Analysis Department, Vietstock Advisory Division
– 12:31 December 9, 2025
Derivatives Market on 12/11/2025: Is the Short-Term Outlook Deteriorating?

On December 10, 2025, both the VN30 and VN100 futures contracts experienced declines during the trading session. The VN30-Index marked its second consecutive day of losses, accompanied by the emergence of a Black Marubozu candlestick pattern.
Vietstock Daily 10/12/2025: Riding the Crest of the Windstorm

The VN-Index reversed its course, closing lower despite trading volumes surpassing the 20-day average as the index approached its October 2025 peak (around 1,760-1,795 points). Short-term risks are escalating, with the Stochastic Oscillator reversing and signaling a strong sell in overbought territory.
Real Estate Stock Surges as Brokerage Firms Unexpectedly Invest Hundreds of Billions Amid Market Downturn

Proprietary trading desks at securities companies recorded a modest net buy of VND 13 billion on the Ho Chi Minh Stock Exchange (HOSE) today.
Market Pulse 12/08: Foreign Investors Net Sell VPL, Vingroup Stocks Continue to Support Index

At the close of trading, the VN-Index climbed 12.42 points (+0.71%) to reach 1,753.74, while the HNX-Index dipped nearly 2 points (-0.76%), settling at 258.68. Market breadth favored decliners, with 446 stocks falling and 268 advancing. The VN30 basket mirrored this trend, as 21 constituents closed lower, 7 higher, and 2 unchanged.
Vietstock Daily 09/12/2025: Approaching Previous Peak with Caution

The VN-Index extended its winning streak to nine consecutive sessions, closely tracking the Upper Band of the Bollinger Bands. However, trading volume dipped below the 20-day average, indicating investor caution. The index is approaching its October 2025 peak (1,760–1,795 points), while the Stochastic Oscillator remains deeply in overbought territory. Should sell signals re-emerge in upcoming sessions, a corrective pullback could materialize.


