


: Record Highs for Gold Bars, Ring Gold Surges by 1.8 Million VND per Tael")


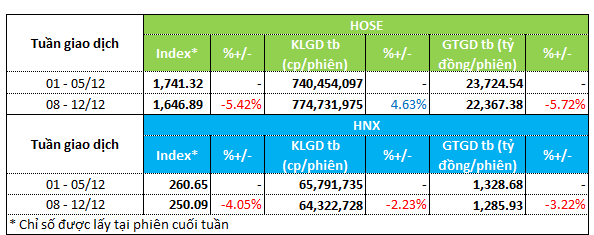
The market experienced a negative trend during the trading week of December 8–12. The VN-Index dropped by over 5%, closing at nearly 1,647 points. The HNX-Index also declined by 4%, settling at 250 points. Trading volume and value witnessed a slight decrease, indicating weakened market liquidity.
On the HOSE exchange, trading volume increased by nearly 5%, reaching 774 million units per session. Conversely, trading value decreased by approximately 6%, to 22.3 million units per session. The HNX exchange recorded declines in both trading volume and value, with a 2% drop in volume to 64.3 million units per session and a 3% decrease in value to over 1.28 trillion VND per session.
|
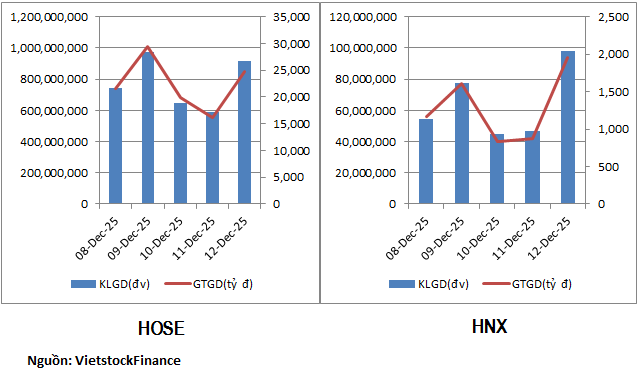
Overview of Liquidity for the Week of December 8–12
|
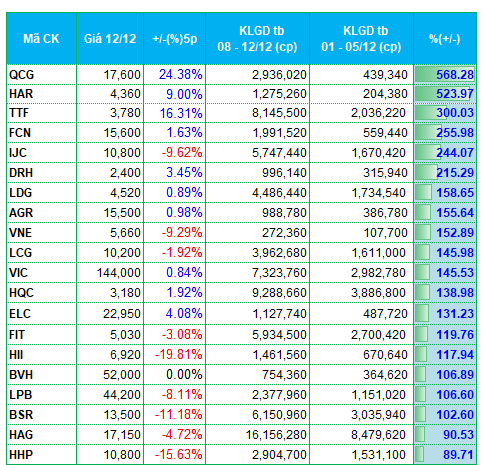
Liquidity showed divergence across various sectors last week, notably in real estate and securities. Both sectors experienced alternating increases and decreases in liquidity. In the real estate sector, QCG and HAR saw trading volumes surge by over 500% compared to the previous week. Other stocks like LDG, VIC, and HQC also recorded significant increases. On the HNX exchange, stocks such as API, IDJ, NDN, VC3, and CEO topped the list for liquidity gains.
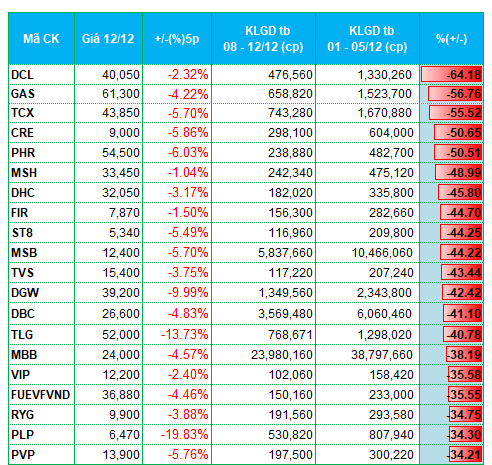
However, several real estate stocks experienced sharp declines in liquidity, including CRE, FIR, AAV, NRC, and TIG.
Similarly, in the securities sector, AGR, APS, and MBS attracted significant liquidity. In contrast, TCX, TVS, BVS, EVS, SHS, and VFS saw substantial liquidity decreases compared to the previous week.
The distribution sector also showed mild divergence, with PSD and HUT experiencing increased liquidity. Meanwhile, DGW and ST8 were among the top stocks with significant liquidity declines last week.
|
Top 20 Stocks with Highest Liquidity Increases/Decreases on HOSE
|
|
Top 20 Stocks with Highest Liquidity Increases/Decreases on HNX
|
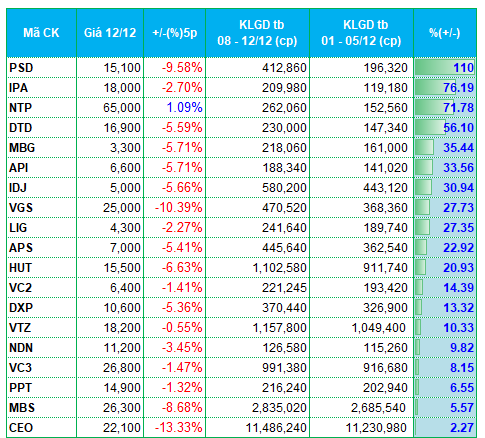
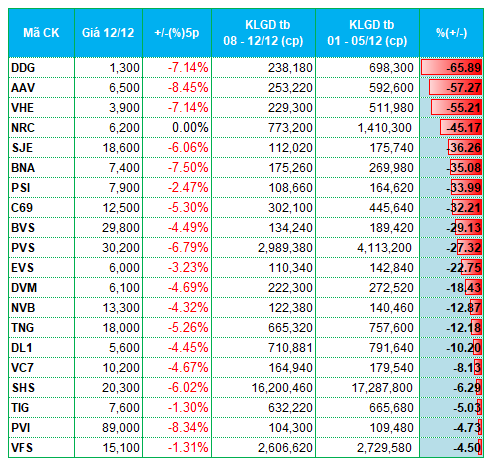
The list of stocks with the highest increases and decreases in liquidity is based on average trading volumes exceeding 100,000 units per session.
– 19:28 15/12/2025
Market Pulse 15/12: VN-Index Fluctuates in Tug-of-War, Foreign Investors Return to Net Buying in First Session of the Week

At the close of trading, the VN-Index dipped by 0.88 points (-0.05%), settling at 1,646.01 points, while the HNX-Index fell by 0.72 points (-0.29%), closing at 249.37 points. Market breadth leaned toward the red, with 389 decliners outpacing 288 advancers. Conversely, the VN30 basket saw green dominate, with 15 gainers, 9 losers, and 6 unchanged stocks.
Vietstock Daily Recap: Market Polarization Resumes on December 16, 2025

The VN-Index exhibited a tug-of-war session, forming a Doji candlestick pattern alongside trading volume dipping below the 20-session average. Both the Stochastic Oscillator and MACD indicators continued to weaken, compounded by the index falling below its 100-day SMA, signaling heightened risk.
Can the Once-Mighty Steel Giant Revive After Shaking Hands with Vingroup, with Nearly 16 Million Shares Bought at Ceiling Price?

The stock price surge, marking six consecutive sessions of hitting the ceiling, has propelled it to its highest level in nearly two years, a feat last seen in April 2024.
Expert Insight: Equilibrium Point Imminent as Two Stock Groups Enter “Oversold” Territory

Anticipating next week’s market trends, most experts agree that prices have entered an attractive range following a significant correction. However, investors should remain cautious, closely monitoring developments and only committing funds once the index establishes a new equilibrium zone.
Vietstock Weekly: December 15-19, 2025 – Rising Risks Ahead?

The VN-Index plunged dramatically, marked by the emergence of a Big Black Candle pattern, while slicing below the Middle line of the Bollinger Bands. Trading volume persistently remained below the 20-week average, indicating investors are still gripped by caution. With the MACD indicator widening its gap from the Signal line following a sell signal since late October 2025, market volatility is likely to persist in the near term.


: Testing Investors’ Patience”")