


: Mixed Signals Emerge")

: Short-Term Outlook Continues to Deteriorate")


XRP: Anticipating Short-Term Recovery at April 2025 Lows
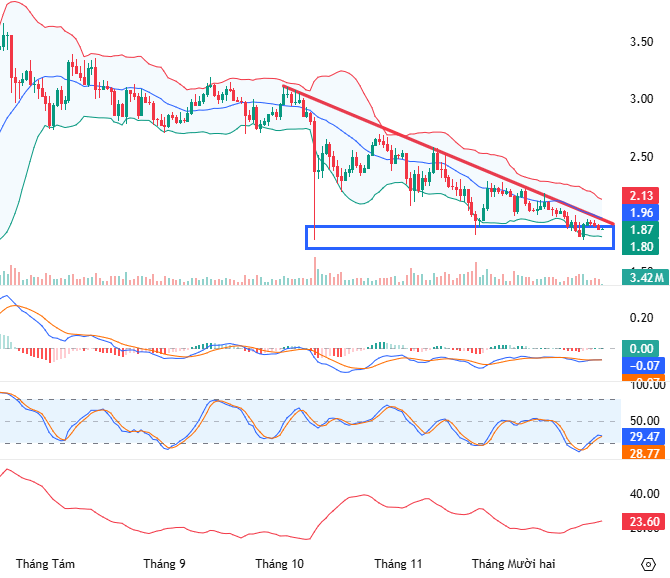
On the weekly chart, XRP continues its downward trend, closely following the lower band of the Bollinger Bands, indicating persistent bearish sentiment.
Additionally, the MACD indicator remains weak and below the zero line after signaling a sell, further amplifying short-term negativity.
However, the Stochastic Oscillator has entered the oversold territory while the price tests the April 2025 lows (around $1.55-$1.77 USD). If this indicator reverses and exits the oversold region, a recovery could be on the horizon.
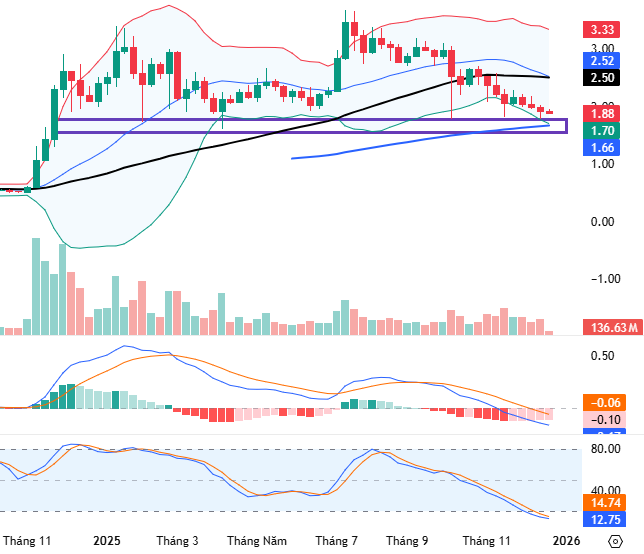
XRP Chart (2024 – 2025) – Source: TradingView
On the daily chart, XRP is retesting the October 2025 lows (around $1.7-$1.9 USD) and remains below the middle band of the Bollinger Bands.
Meanwhile, the ADX indicator is hovering in the neutral zone (20 < ADX < 25), suggesting indecision in the market.
In summary, XRP is expected to trade sideways within a narrow range in the short term until clearer technical recovery signals emerge at the critical support level of the April 2025 lows. Investors should monitor price movements here for potential new buying opportunities.
XRP Chart (2025) – Source: TradingView
SOL: Testing the Lower Boundary of Descending Triangle Pattern
On the weekly chart, SOL continues its short-term downtrend, trading below the middle band of the Bollinger Bands, indicating no immediate signs of improvement.
Furthermore, the price is retesting the April 2025 lows (around $100-$123 USD) as the gap between the 50-week SMA and 100-week SMA narrows. A potential death cross and breakdown below this support level could worsen the long-term outlook.
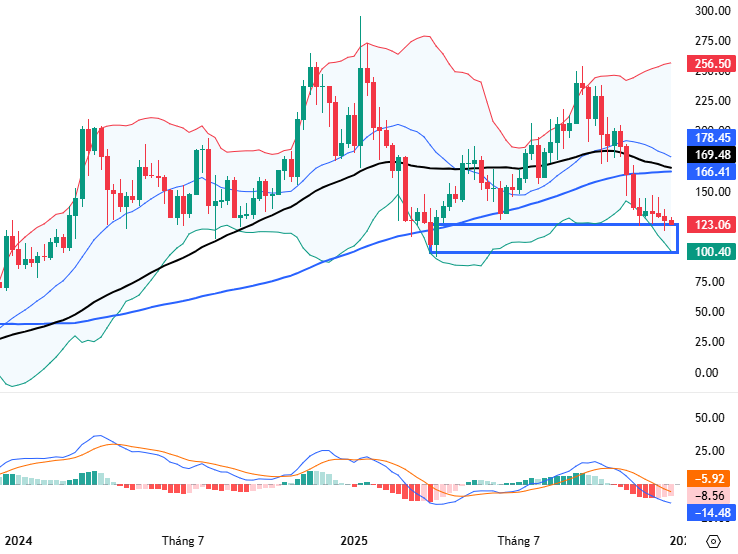
SOL Chart (2024 – 2025) – Source: TradingView
On the daily chart, while SOL’s downward momentum is weakening, the price remains below the middle band of the Bollinger Bands, showing no clear short-term improvement.
Currently, SOL is testing the lower boundary (around $115-$125 USD) of a Descending Triangle pattern, with the MACD rising toward the zero line after a buy signal. If technical indicators continue to improve and the price holds at current levels, a short-term technical rebound may occur.
In conclusion, SOL’s mid-term outlook remains challenging. Investors should await more definitive positive technical signals before making decisions.
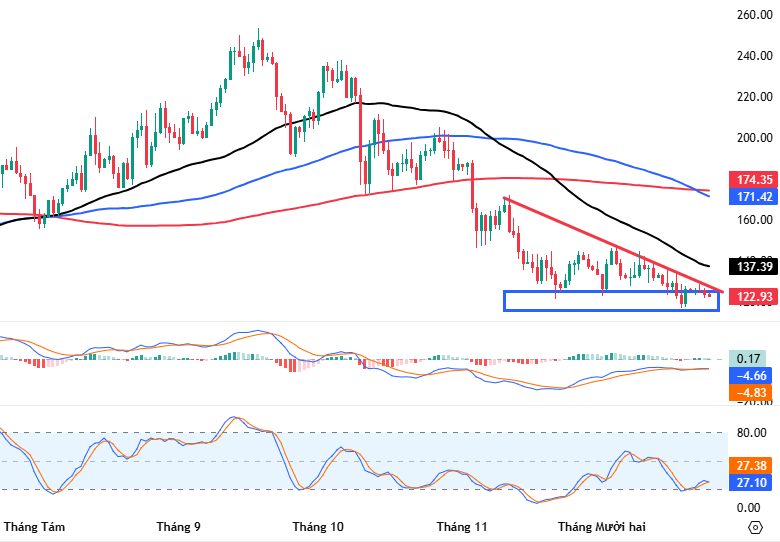
SOL Chart (2025) – Source: TradingView
Technical Analysis Department, Vietstock Advisory Division
– 11:40 24/12/2025
Vietstock Daily 24/12/2025: Breaking Boundaries?

The VN-Index has set a new all-time high (based on closing price), marking its fourth consecutive session of gains while closely tracking the Upper Band of the Bollinger Bands. Both the MACD and Stochastic Oscillator indicators maintain their positive upward trajectory, reinforcing earlier buy signals. The outcome of testing the previous October 2025 peak (around 1,740-1,795 points) will be pivotal in determining the index’s future direction.
Technical Analysis for the Afternoon Session of December 23: Sustained Growth Continues

The VN-Index continues its upward trajectory, even as it retests the October 2025 peak (equivalent to the 1,740–1,795 point range). Meanwhile, the HNX-Index experiences intense volatility, forming a Doji candlestick pattern.
Technical Analysis for the Afternoon Session of December 22: Preparing to Test the October 2025 High

The VN-Index continues its upward trajectory, edging closer to its October 2025 peak (ranging between 1,740 and 1,795 points). Meanwhile, the HNX-Index marked its third consecutive session of gains, with the MACD indicator signaling a renewed buying opportunity.
Vietstock Weekly 22-26/12/2025: Can the Market Sustain Its Momentum?

The VN-Index rebounded with a prominent Big White Candle pattern, as the Bollinger Bands’ Middle Line continues to provide robust support for the medium-term trend. However, the index is likely to face continued volatility and challenges in reclaiming its October 2025 highs, given that trading volume has remained below the 20-week average for nine consecutive weeks.
Technical Analysis Afternoon Session 19/12: Breaking Above the 50-Day SMA

The VN-Index surged, decisively breaking above its 50-day SMA, while the Stochastic Oscillator signaled a fresh buy opportunity. Meanwhile, the HNX-Index maintained its modest recovery despite intraday volatility.


: The Optimism Persists”")

