


: Mixed Signals Emerge")

: Short-Term Outlook Continues to Deteriorate")
I. MARKET ANALYSIS OF THE 08/01/2026 BASE STOCK SESSION
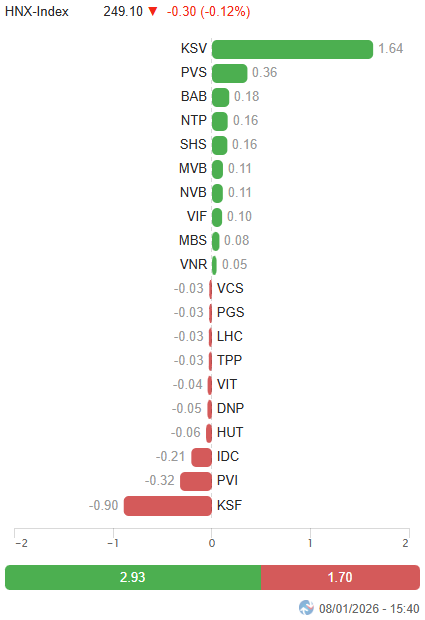
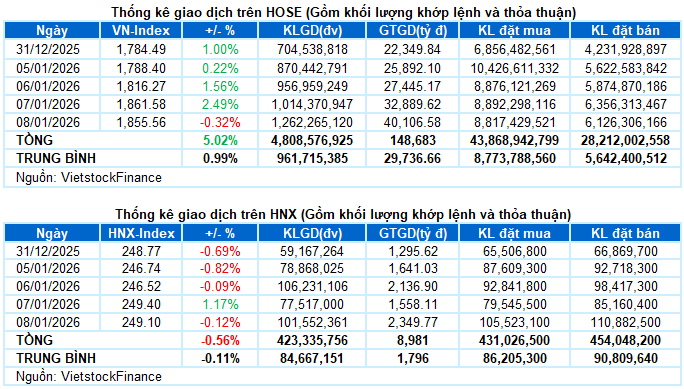
– Major indices reversed course, closing lower on January 8th. The VN-Index retreated 0.32% to 1,855.56 points, while the HNX-Index dipped 0.12%, ending at 249.1 points.
– Market liquidity continued its notable improvement. Order-matching volume on the HOSE surged 26.2% to nearly 1.2 billion units. The HNX recorded almost 94 million matched units, a robust 39.8% increase from the previous session.
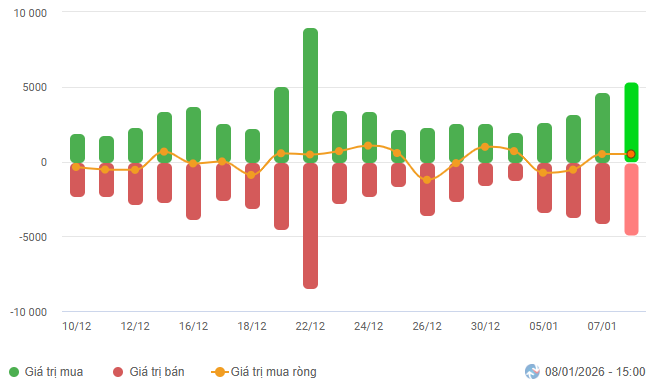
– Foreign investors maintained net buying, with values of nearly VND 294 billion on the HOSE and VND 85 billion on the HNX.
Foreign Investors’ Trading Value on HOSE, HNX, and UPCOM by Date. Unit: Billion VND
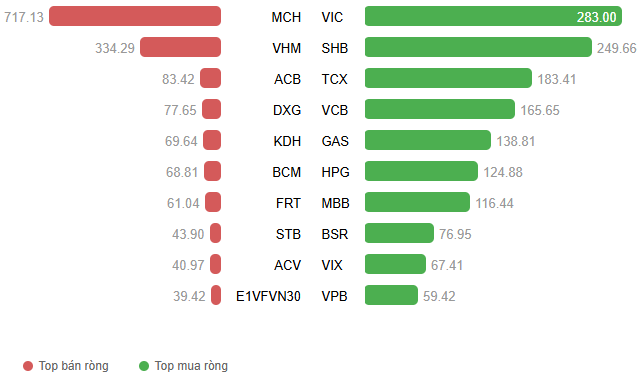
Net Trading Value by Stock Code. Unit: Billion VND
– The market corrected on January 8th, characterized by divergence. Early enthusiasm propelled the VN-Index close to 1,890 points, but the rally stalled as leading stocks cooled after a strong run, and investors became more selective. This led to a tug-of-war with persistent fluctuations around 1,870 points for most of the session. Late-session profit-taking pressure intensified, pushing the index into negative territory just before the ATC session, particularly due to the reversal of Vingroup stocks. The VN-Index closed down 6 points at 1,855.56.
– Among market caps, VS-Large Cap, VS-Mid Cap, and VS-Small Cap all saw slight declines. Selling pressure emerged late, reflecting short-term profit-taking after the prior rally.
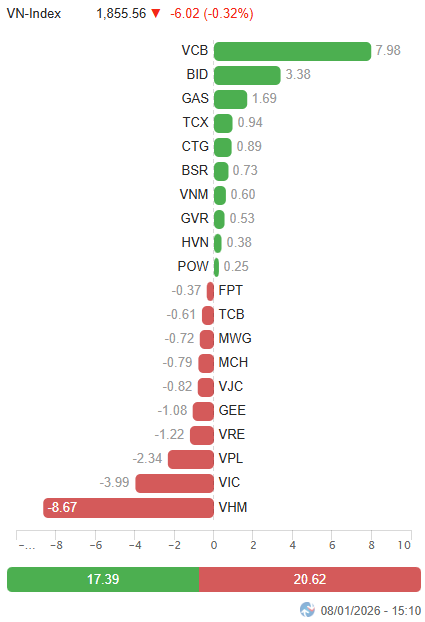
– Vingroup stocks dominated the downside, with VHM, VIC, VPL, and VRE collectively erasing over 16 points from the VN-Index. Conversely, VCB, BID, and GAS provided support, contributing around 13 points and mitigating losses.
Top Stocks Influencing the Index. Unit: Points
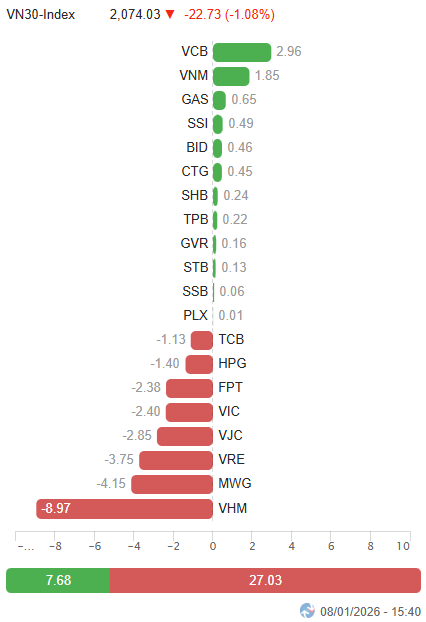
– The VN30-Index plunged late, closing at 2,074.03, down 1.08%. The basket was mixed: 16 decliners, 12 advancers, and 2 unchanged. VHM and VRE faced heavy selling, hitting their lower limits, followed by VJC, MWG, and DGC (down 2-3%). Conversely, VCB surged impressively, with BID and GAS up 5.1% and 3.5%, respectively.
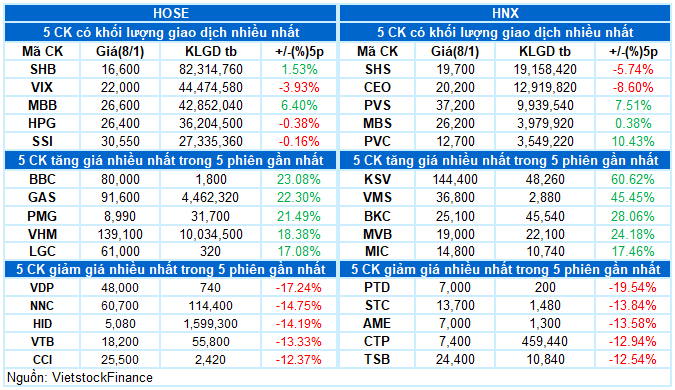
State-owned enterprise (SOE) stocks were today’s focus, as divestment expectations continued to attract strong investor interest. Numerous high state-owned stocks maintained positive momentum on robust demand, notably VCB and KSV hitting ceilings, BID (+5.13%), BSR (+3.62%), GAS (+3.5%), POW (+2.94%), VGI (+3.43%), ACV (+5.38%), and HVN (+2.12%). Their large market caps significantly boosted financials, energy, utilities, telecom, and industrials.
Conversely, non-essential consumer stocks led declines, pressured by VPL (-6.37%), MWG (-2.56%), FRT (-4.33%), DGW (-4.07%), HHS (-2.04%), and TNG (-1.08%).
Real estate also struggled, down 2.71%. Beyond the Vin trio’s correction, IDC, KDH, TCH, VPI, NTL, CKG, KSF, and VCR fell over 2%.
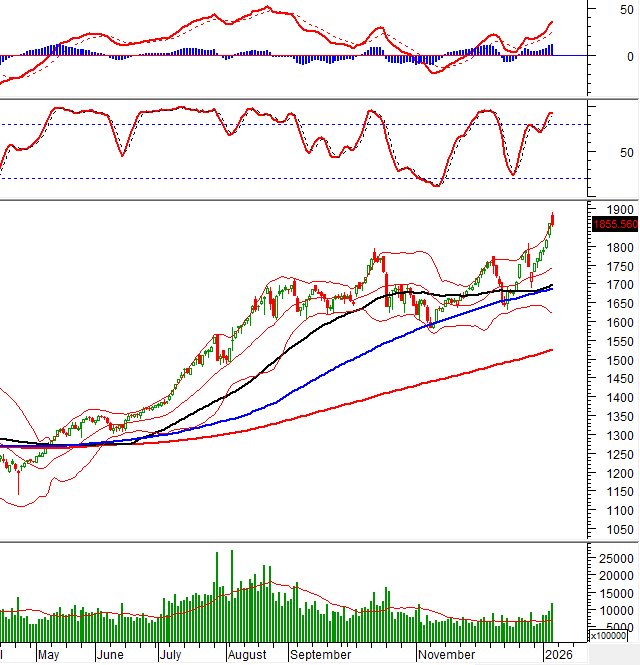
The VN-Index corrected after a 6-session rally, with volume above the 20-day average. Short-term prospects remain positive as the index hugs the Bollinger Bands’ Upper Band and MACD trends upward, though overbought Stochastic Oscillator readings suggest heightened volatility risk.
II. PRICE TREND AND VOLATILITY ANALYSIS
VN-Index – Stochastic Oscillator Deep in Overbought Territory
The VN-Index corrected after a 6-session rally, with volume above the 20-day average.
Short-term prospects remain positive as the index hugs the Bollinger Bands’ Upper Band, and MACD trends upward, widening its Signal line gap. However, the Stochastic Oscillator’s deep overbought reading warrants caution for potential reversals.
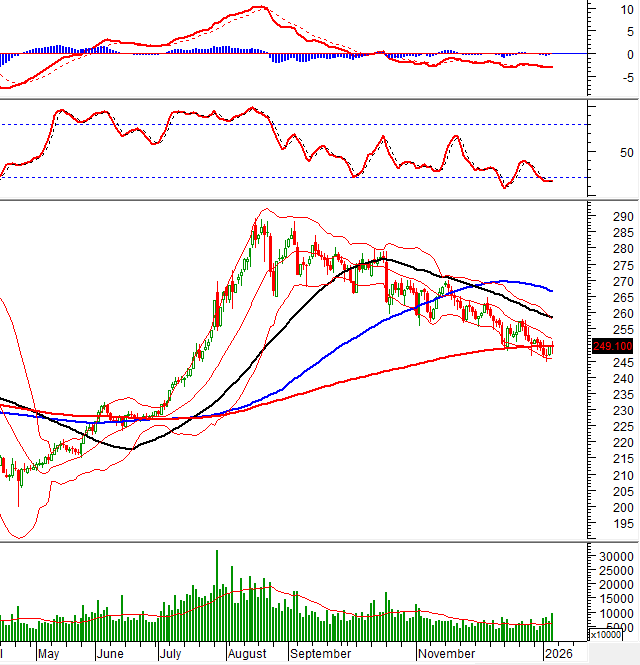
HNX-Index – Tug-of-War at the 200-Day SMA
The HNX-Index struggled at the 200-day SMA, reflecting investor indecision.
The Stochastic Oscillator improved after a buy signal in oversold territory, while MACD narrows its Signal line gap. A MACD buy signal would enhance short-term prospects.
Liquidity Analysis
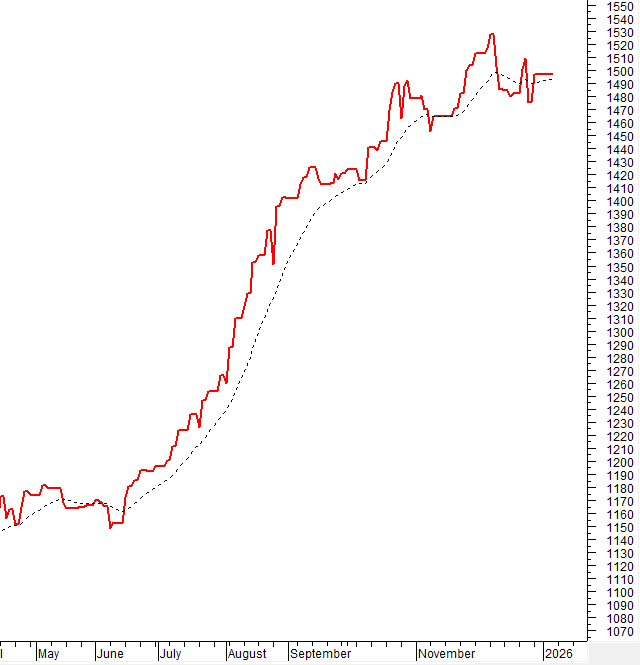
Smart Money Flow: The VN-Index Negative Volume Index remains above the 20-day EMA. Continued strength here would limit sudden downside thrust risks.
Foreign Investor Flow: Foreigners remained net buyers on January 8th. Continued buying would sustain optimism.
III. MARKET STATISTICS FOR 08/01/2026
Economic Analysis & Market Strategy Division, Vietstock Advisory Department
– 17:09 08/01/2026
Vietstock Daily 07/01/2026: Embarking on a New Journey?

The VN-Index extended its winning streak to a fifth consecutive session, marked by a robust green candle, decisively breaching the previous October 2025 peak to reinforce the prevailing uptrend. Short-term outlook remains highly optimistic, supported by both the Stochastic Oscillator and MACD indicators sustaining their upward trajectories following buy signals.
Vietstock Daily 06/01/2026: Intense Tug-of-War in the Market

The VN-Index continues to fiercely oscillate around its October 2025 peak (equivalent to the 1,740-1,795 point range). With the Stochastic Oscillator signaling a buy opportunity and the MACD sustaining its upward momentum, short-term risks appear manageable. However, investors should remain cautious of potential volatility as the index navigates a robust resistance zone.
Technical Analysis for the Afternoon Session of January 7th: Soaring to New Heights

The VN-Index has continued its robust growth trajectory, decisively breaking through the previous peak established in October 2025 (equivalent to the 1,740-1,795 point range). Meanwhile, the HNX-Index has halted its decline and rebounded, signaling a recovery in momentum.
Market Pulse 07/01: Green Wave Sweeps Across Markets, VN-Index Surges Over 45 Points

At the close of trading, the VN-Index surged by 45.31 points (+2.49%), reaching 1,861.58 points, while the HNX-Index climbed 2.88 points (+1.17%) to 249.4 points. Market breadth was overwhelmingly positive, with 511 gainers and only 212 decliners. Similarly, the VN30 basket saw a dominant green trend, with 28 advancing stocks and just 2 declining.
Capital Flows Diverge Across Stocks and Construction Sectors in the Final Week of 2025

Liquidity dwindled during the final trading week of 2025, with capital flows diverging between securities and construction stocks.


