


: Mixed Signals Emerge")

: Short-Term Outlook Continues to Deteriorate")
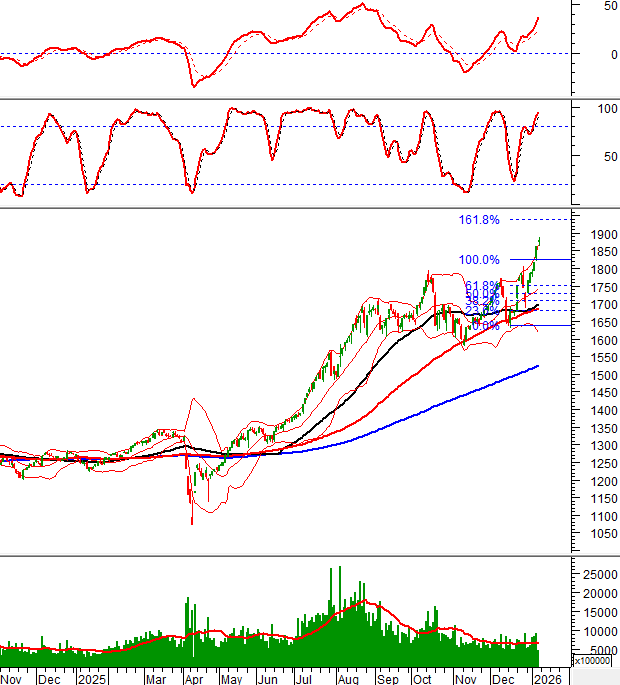
Technical Signals of VN-Index
During the morning trading session on January 8, 2026, the VN-Index continued its remarkable rally, setting a new all-time high with seven consecutive sessions of gains.
The index remains firmly attached to the Upper Band of the Bollinger Bands, with the next target set at the 1,935-1,950 point range.
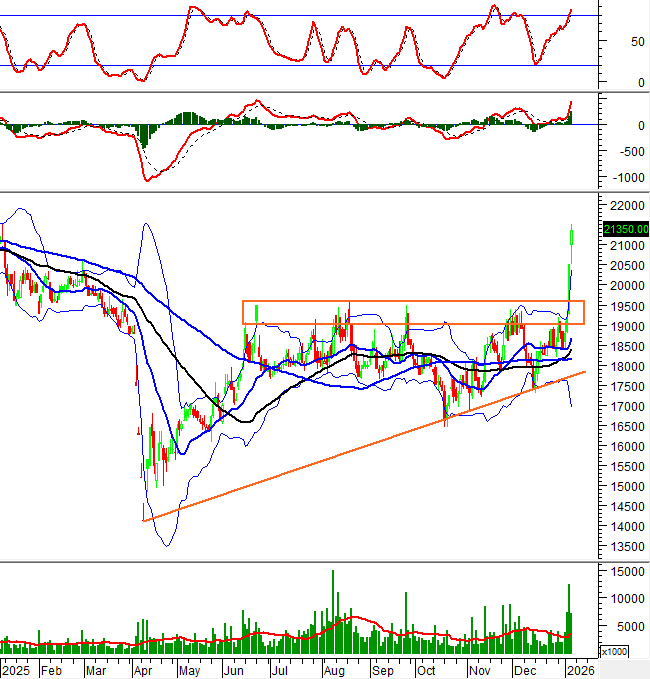
Technical Signals of HNX-Index
In the morning session on January 8, 2026, the HNX-Index saw a slight increase and is in the process of forming a Falling Wedge pattern.
The Stochastic Oscillator indicates a buy signal, supported by trading volumes consistently above the 20-day average.

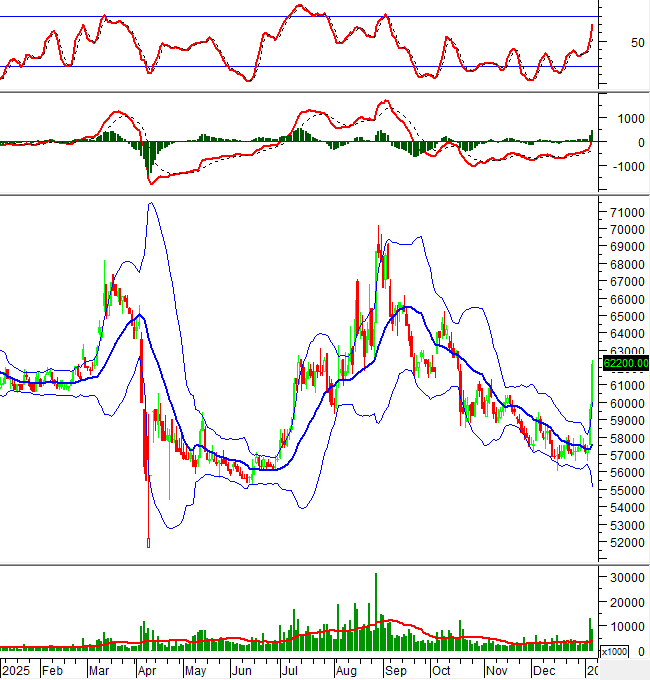
PVT – PetroVietnam Transportation Corporation
On the morning of January 8, 2026, PVT shares rose for the fourth consecutive session, accompanied by trading volumes exceeding the 20-session average, reflecting investor optimism.
Currently, PVT prices are closely following the Upper Band of the Bollinger Bands after a Golden Cross between the 50-day SMA and 100-day SMA, indicating a more positive medium-term outlook.
Additionally, the MACD indicator continues to form higher highs and higher lows after generating a buy signal, further supporting the current upward trend of PVT.
VCB – Vietcombank
On January 8, 2026, VCB shares rose for the third consecutive session, accompanied by a Big White Candle pattern and trading volumes surpassing the 20-session average, indicating investor confidence.
Currently, VCB continues to rise, with the Bollinger Bands expanding and the Stochastic Oscillator ascending after a buy signal. If this positive momentum persists, the recovery trend will be more sustainable.
(*) Note: The analysis in this article is based on real-time data as of the end of the morning session. Therefore, signals and conclusions are for reference only and may change after the afternoon session concludes.
Technical Analysis Department, Vietstock Advisory Division
– 12:05 January 8, 2026
Will Real Estate Stocks Continue to Outperform and Remain Attractive in 2026?

After two years of bottoming out (2023-2024), real estate stocks staged a remarkable comeback in 2025, emerging as the top-performing sector in the market. What fueled this turnaround, and will the momentum persist into 2026?
The Foundation for VN-Index to Reach 2,032 Points

The year 2026 marks the beginning of a new growth cycle, where strategically positioning your investments from the outset will be pivotal to success.
Foreign Block “U-Turns” with Over 700 Billion VND Net Sell-Off in First Session of the New Year, While Aggressively Accumulating a Banking Stock

Vingroup stocks topped today’s net sell list, recording a value of 182 billion VND.
January 5th Session: Proprietary Trading Firms Reverse Course, Net Selling Nearly VND 600 Billion – Which Stocks Were Hit Hardest?

Proprietary trading firms net sold VND 542 billion on the Ho Chi Minh Stock Exchange (HOSE).
Vietnamese Stock Market Surges Past 1,800 Points, Setting an All-Time Record

The 1.6% surge propelled the HoSE market capitalization by an impressive 130 trillion VND, bringing it tantalizingly close to the 8.5 quadrillion VND milestone.


