


: Mixed Signals Emerge")

: Short-Term Outlook Continues to Deteriorate")
I. MARKET ANALYSIS OF THE UNDERLYING STOCK MARKET ON JANUARY 13, 2026
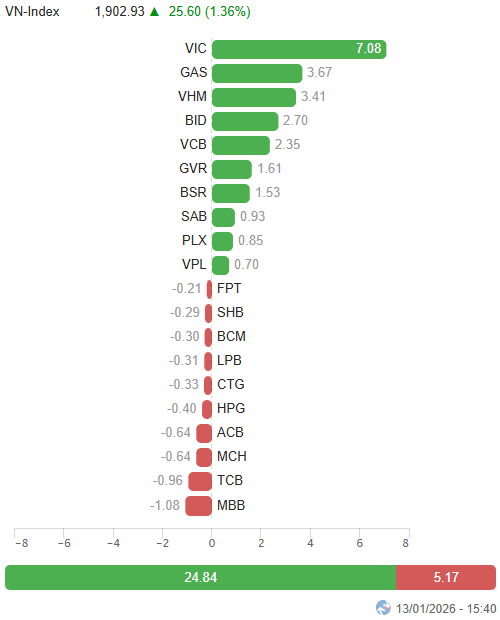
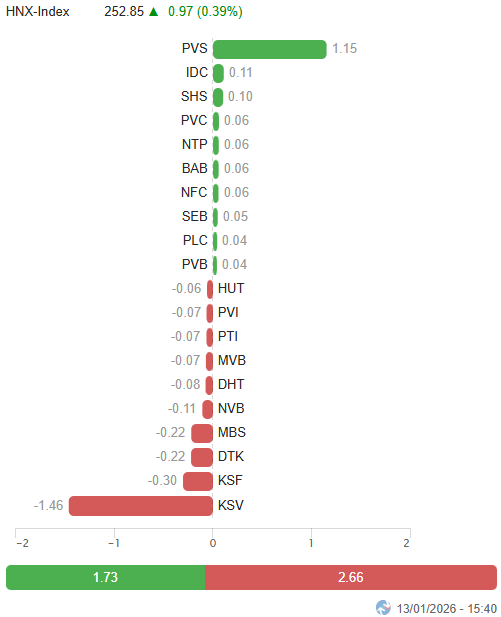
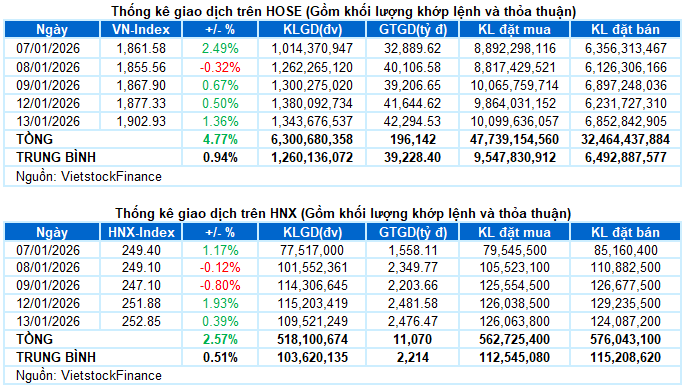
– Major indices continued to rise during the January 13 trading session. Specifically, the VN-Index surged by 1.36%, reaching 1,902.93 points. The HNX-Index also increased by 0.39%, closing at 252.85 points.
– Trading volume on the HOSE floor slightly decreased by 2.5%, totaling nearly 1.3 billion units. The HNX floor recorded over 108 million matched units, a 2.1% decline compared to the previous session.
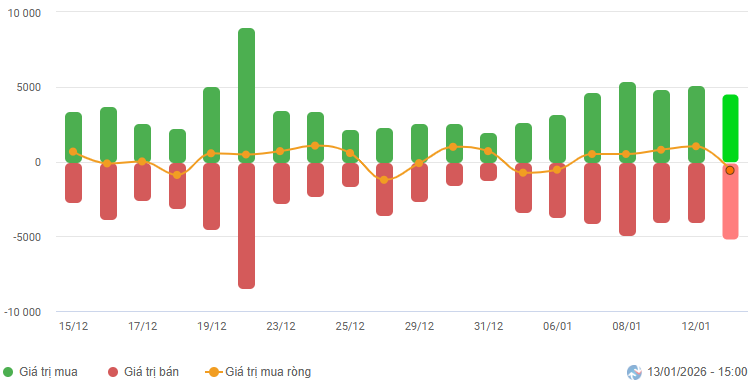
– Foreign investors returned to net selling, with a value of over 484 billion VND on the HOSE and 47 billion VND on the HNX.
Foreign Investors’ Trading Value on HOSE, HNX, and UPCOM by Date. Unit: Billion VND
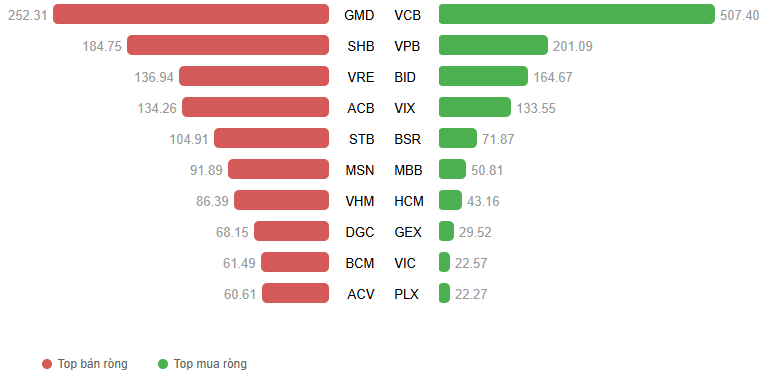
Net Trading Value by Stock Code. Unit: Billion VND
– The market maintained its positive momentum during the January 13 session. Leading stocks took turns driving the market, helping the VN-Index sustain a steady rise throughout the session, despite increased profit-taking pressure on recently surged stocks, leading to a more polarized market breadth. The index gradually expanded its gains and successfully surpassed the 1,900-point milestone, setting a new historical record. At the close, the VN-Index settled at 1,902.93 points, a 1.36% increase from the previous session.
– Among market capitalization groups, the upward trend was firmly supported by the outperformance of VS-Large Cap, while VS-Mid Cap and VS-Small Cap also maintained positive growth, contributing to the overall trend.
– In terms of influence, VIC was the most significant contributor, adding over 7 points to the VN-Index. The gains were further bolstered by GAS, VHM, BID, and VCB, collectively contributing around 12 points. Conversely, MBB and TCB exerted the most significant pressure, subtracting approximately 2 points from the index.
Top Influencing Stocks on the Index. Unit: Points
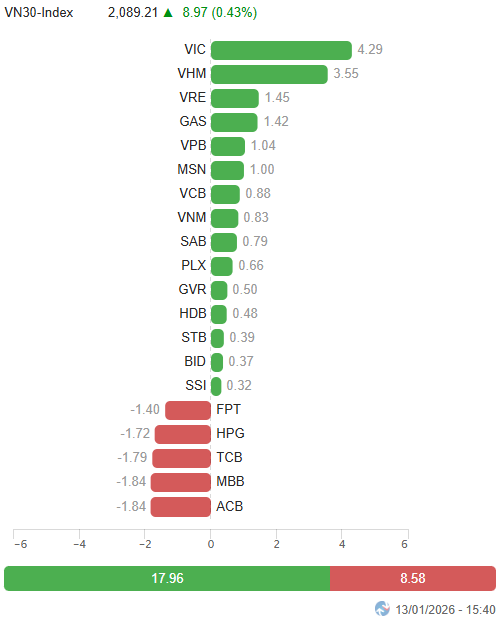
– The VN30-Index closed with a nearly 9-point gain (+0.43%), reaching 2,089.21 points. The basket’s breadth was relatively balanced, with 15 gainers, 13 losers, and 2 unchanged stocks. Notably, PLX, GAS, and SAB were the top performers, closing in the purple, alongside GVR and BID, which recorded significant gains of 5.6% and 3.6%, respectively. On the downside, ACB and MBB faced the strongest selling pressure, ending at the bottom with losses exceeding 2%.
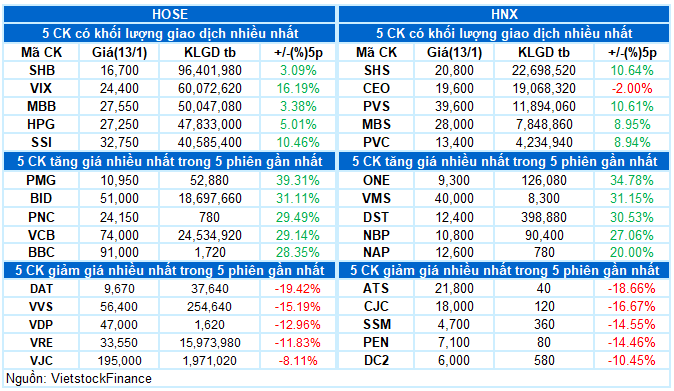
Green dominated most sectors. The energy sector made an impressive comeback, with purple appearing across leading stocks such as BSR, PLX, PVS, PVD, PVT, and PVC, or significant gains in OIL (+5.93%), PVP (+3.01%), VTO (+1.72%), VIP (+2.42%), POS (+4.52%), and PVB (+8.5%).
Large-cap sectors like real estate, finance, and industry also traded actively, with highlights including VIC (+2.57%), VHM (+2.92%), VRE (+2.91%), KDH (+2.74%); VCB (+1.79%), BID (+3.55%), VPX (+4.08%), BVH (+2.88%), F88 (+11.3%); GEE (+4.06%), GEX (+6.17%), VCG (+1.97%), and even stocks hitting their upper limits like EIB, VIX, CC1, and VSC. However, several stocks recorded notable adjustments, including BCM (-2%), VPI (-2.88%); TCB (-1.71%), MBB (-2.3%), ACB (-2.35%), LPB (-1.18%), SHB (-1.76%); ACV (-3.99%), and MVN (-2.63%).
Conversely, the information technology sector lagged, adjusting by 0.62% under significant pressure from leading stocks such as FPT (-0.6%), CMG (-0.41%), ELC (-0.63%), and VEC (-4.21%).
The VN-Index broke through the 1,900-point mark robustly, setting a new high as liquidity remained above the 20-day average. The short-term outlook continues to be supported as the index closely follows the Upper Band of the Bollinger Bands, and the MACD consistently widens its gap with the Signal line. However, the Stochastic Oscillator shows signs of weakening in the overbought zone, so investors should be cautious about potential technical shakeouts in upcoming sessions.
II. PRICE TREND AND VOLATILITY ANALYSIS
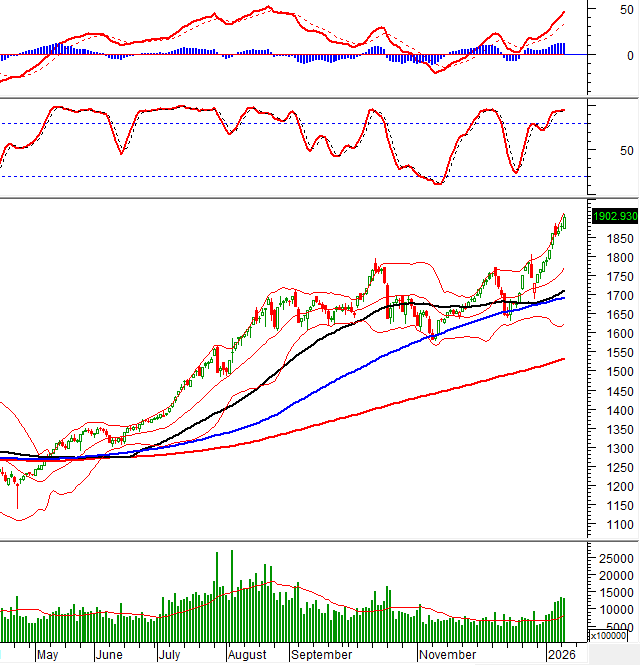
VN-Index – Surpassing the 1,900-point milestone
The VN-Index surged past the 1,900-point mark, setting a new high as liquidity remained above the 20-day average, indicating continued support from the buying momentum.
The short-term outlook remains positive as the index closely follows the Upper Band of the Bollinger Bands, and the MACD consistently widens its gap with the Signal line. However, the Stochastic Oscillator shows signs of weakening in the overbought zone, so investors should be cautious about potential shakeouts if sell signals emerge in the coming sessions.
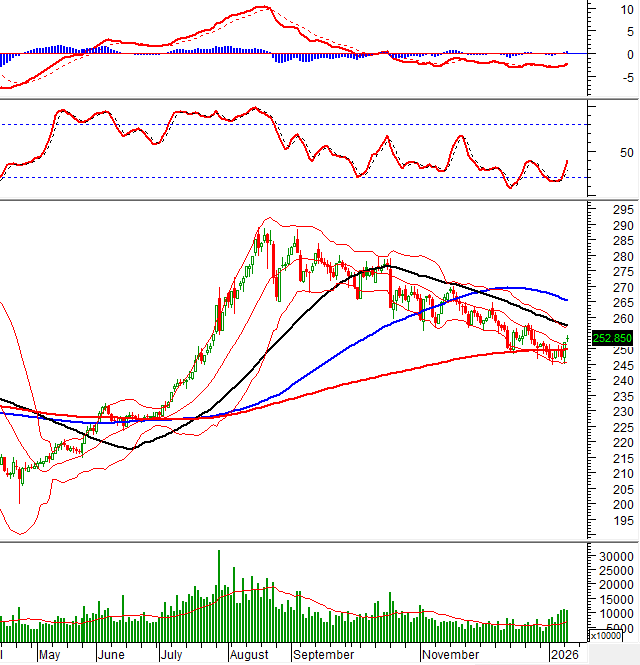
HNX-Index – Continuing its recovery
The HNX-Index rose slightly, forming a candle pattern resembling a Doji. Trading volume has consistently remained above the 20-day average in recent sessions, indicating an improvement in buying interest.
Both the Stochastic Oscillator and MACD continue to rise after giving buy signals, further supporting the short-term recovery outlook.
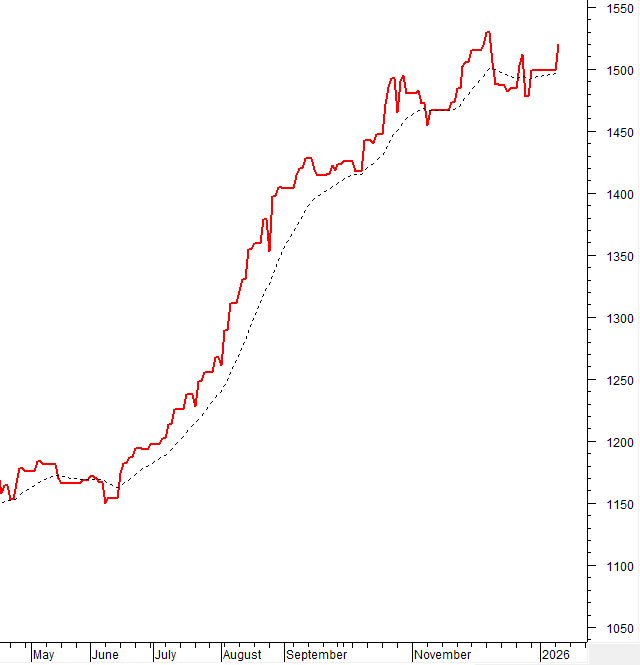
Smart Money Flow Analysis
Smart Money Movement: The Negative Volume Index of the VN-Index is currently above the 20-day EMA. If this condition persists in the next session, the risk of a sudden downturn (thrust down) will be mitigated.
Foreign Investor Flow Movement: Foreign investors returned to net selling in the January 13, 2026 session. If foreign investors maintain this action in the coming sessions, shakeouts may occur.
III. MARKET STATISTICS FOR JANUARY 13, 2026
Economic Analysis & Market Strategy Department, Vietstock Consulting Division
– 17:15 January 13, 2026
Technical Analysis for the Afternoon Session of January 13th: Continuing to Set New Highs

The VN-Index continues its upward trajectory, setting a new all-time high. The index is now targeting the 1,935-1,950 point range. Meanwhile, the HNX-Index shows robust growth, breaking above the upper boundary of its Falling Wedge pattern.
KLB Stock Leads Industry-Wide Surge in 2025

As 2025 drew to a close, Kien Long Commercial Joint Stock Bank’s KLB stock soared by 131.4%, marking the highest surge among banking stocks and significantly outpacing the VN-Index’s 41% growth.
Market Pulse 13/01: VN-Index Nears 1,900, Banking Sector Faces Selling Pressure

The VN-Index surged to a high of 1,900 during today’s morning session, fueled by the strong performance of VIC and VHM. VIC alone contributed nearly 14 index points, rising almost 5 points. This upward momentum extended to the real estate sector, with another Vingroup affiliate, VRE, climbing over 4%.
Technical Analysis for the Afternoon Session of January 12: Aiming for New Targets

The VN-Index continues its upward trajectory, eyeing a new target range of 1,935-1,950 points. Meanwhile, the HNX-Index has seen a robust increase, positioning itself to potentially test the upper boundary of the Falling Wedge pattern.
Stock Market Reversal: Early Signs of a New Wave?

Following a prolonged adjustment period since the peak of the upgrade phase, the securities stock group is now exhibiting notable reversal signals, with a collective surge observed during the trading session on January 12th.


