


: Mixed Signals Emerge")

: Short-Term Outlook Continues to Deteriorate")
Technical Signals of the VN-Index
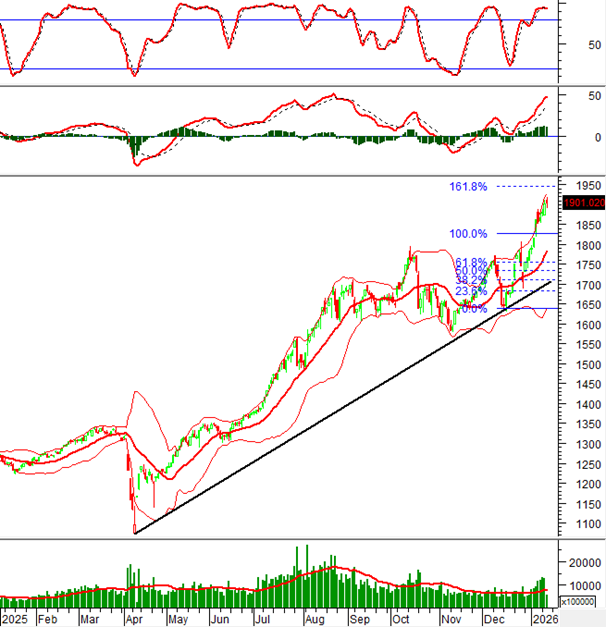
During the morning trading session on January 14, 2026, the VN-Index fluctuated after reaching a new all-time high. The index is now targeting the 1,935-1,950 point range.
Trading volume consistently surpassed the 20-day average, indicating rising optimism and a return of capital to the market.
The previous peak from October 2025 has been fully breached and will shift from a resistance to a strong support level in the coming period.
Technical Signals of the HNX-Index
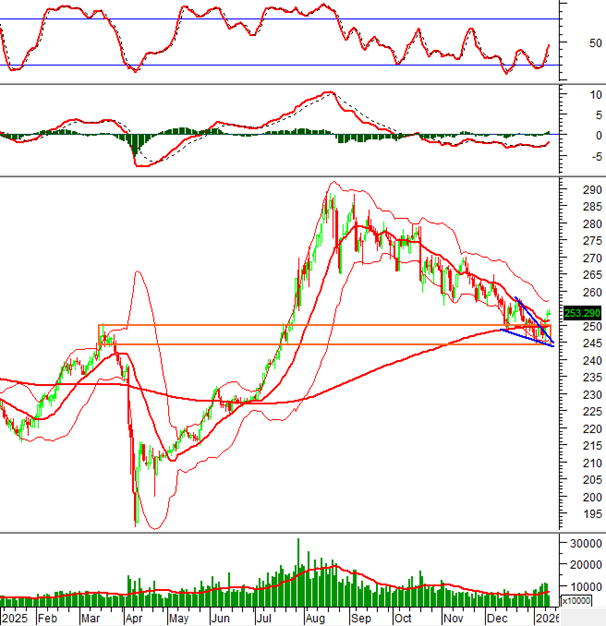
In the morning session on January 14, 2026, the HNX-Index showed robust growth, maintaining its position at the upper edge of a Falling Wedge pattern.
Both the Stochastic Oscillator and MACD indicators surged following earlier buy signals, significantly improving the short-term outlook.
CTR – Viettel Construction Joint Stock Corporation
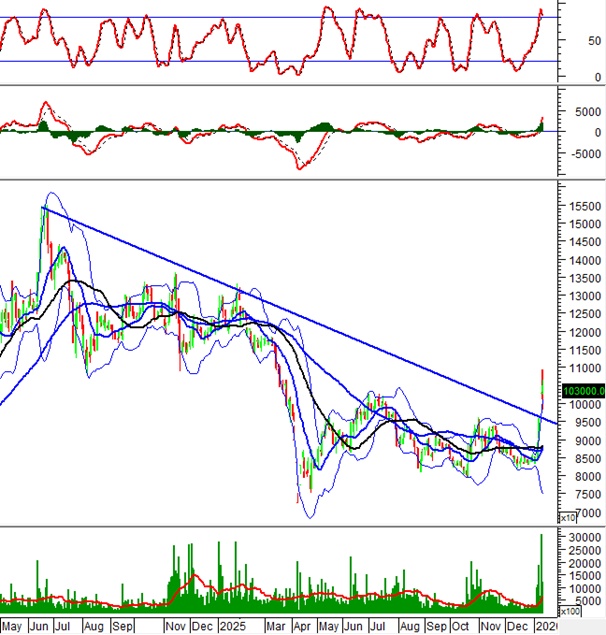
On January 14, 2026, CTR shares rose during the morning session, accompanied by a High Wave Candle pattern and trading volume exceeding the 20-session average, reflecting investor uncertainty.
Currently, CTR prices continue to rise, closely tracking the Upper Band after successfully breaking through the long-term downward trendline.
Additionally, a Golden Cross between the 50-day SMA and 100-day SMA, coupled with the MACD forming higher highs and higher lows, further supports the current trend.
DGW – Digital World Joint Stock Company
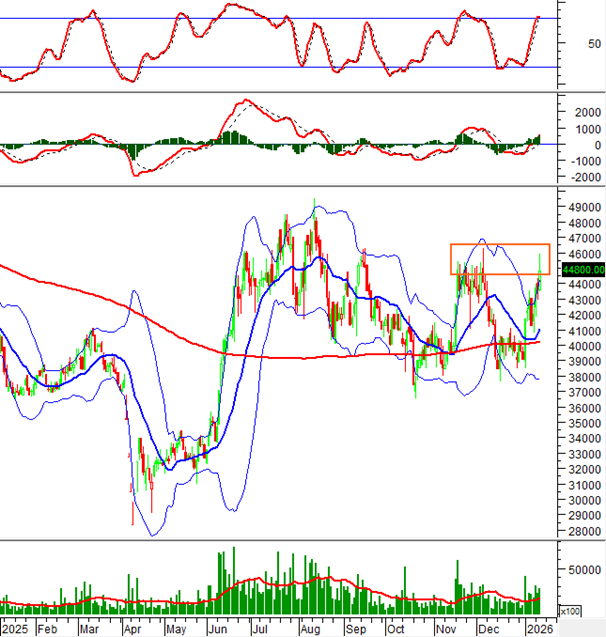
During the morning session on January 14, 2026, DGW shares climbed, accompanied by a Big White Candle pattern and trading volume surpassing the 20-session average, signaling investor optimism.
Presently, DGW prices are retesting the November 2025 peak (around 44,500-46,500) as the Stochastic Oscillator enters overbought territory. If sell signals reemerge and the indicator exits this zone in upcoming sessions, short-term risks will increase.
(*) Note: The analysis in this article is based on real-time data as of the end of the morning session. Therefore, signals and conclusions are for reference only and may change by the close of the afternoon session.
Technical Analysis Department, Vietstock Advisory Division
– 12:17 January 14, 2026
Market Pulse 14/01: Fluctuations Around the 1,900-Point Threshold

The VN-Index experienced intense volatility in the latter half of the morning session, briefly approaching the 1,920-point threshold, only to swiftly retreat as profit-taking pressures resurfaced.
Bank Stocks: The Catalyst for Market Fluidity Around the 1,900-Point Mark

In just the first two weeks of trading in 2026, bank stocks have already taken center stage, consistently setting new record highs and capturing the market’s attention.
Market Pulse 13/01: Purple Wave Sweeps Across Energy Sector

The VN-Index has officially surpassed the historic 1,900 milestone, closing at 1,902.93 points on January 13th. Meanwhile, the HNX-Index also saw gains, ending the session at 252.85 points.
VN-Index Surges Past 1,900 Mark Just One Week After Breaking 1,800 Barrier

The VN-Index has etched another chapter in its historic journey, surpassing the 1,900-point milestone. With consistent breakthroughs to new highs—and forecasts from experts suggesting even greater potential—this achievement solidifies the market’s robust mid- to long-term upward trajectory.
Vietstock Daily 14/01/2026: Breaking the 1,900-Point Barrier

The VN-Index surged decisively past the 1,900-point milestone, setting a new record high as trading volume remained above its 20-day average. Short-term momentum is further bolstered by the index closely tracking the Upper Band of the Bollinger Bands, while the MACD continues to widen its gap from the Signal line. However, caution is warranted as the Stochastic Oscillator shows signs of weakness in overbought territory, suggesting potential technical pullbacks in upcoming sessions.


