I. FUTURES CONTRACTS OF THE STOCK MARKET INDEX
I.1. Market Trends
Most VN30 futures contracts rose during the January 19, 2026 trading session. Specifically, 41I1G2000 (I1G2000) increased by 0.37%, reaching 2,088.9 points; 41I1G3000 (I1G3000) decreased by 0.2%, closing at 2,088.5 points; 41I1G6000 (I1G6000) rose by 0.29%, hitting 2,083 points; and 41I1G9000 (I1G9000) edged up by 0.01%, reaching 2,075 points. The underlying index, VN30-Index, closed at 2,094.24 points.
Additionally, most VN100 futures contracts also saw gains on January 19, 2026. Notably, 41I2G2000 (I2G2000) dropped by 0.82%, closing at 1,945.5 points; 41I2G3000 (I2G3000) fell by 0.24%, ending at 1,951.7 points; 41I2G6000 (I2G6000) dipped by 0.05%, closing at 1,948.1 points; and 41I2G9000 (I2G9000) remained unchanged at the reference level of 1,979.6 points. The underlying index, VN100-Index, closed at 1,971.81 points.
During the January 19, 2026 session, the 41I1G2000 contract initially declined sharply at the open but quickly rebounded in the first half. However, selling pressure re-emerged, weakening the contract to near the reference level for the remainder of the morning session. In the afternoon, 41I1G2000 entered a prolonged stalemate, though the Long side maintained a slight advantage, helping the contract close in positive territory at 2,088.9 points.
Intraday Chart of 41I1G2000
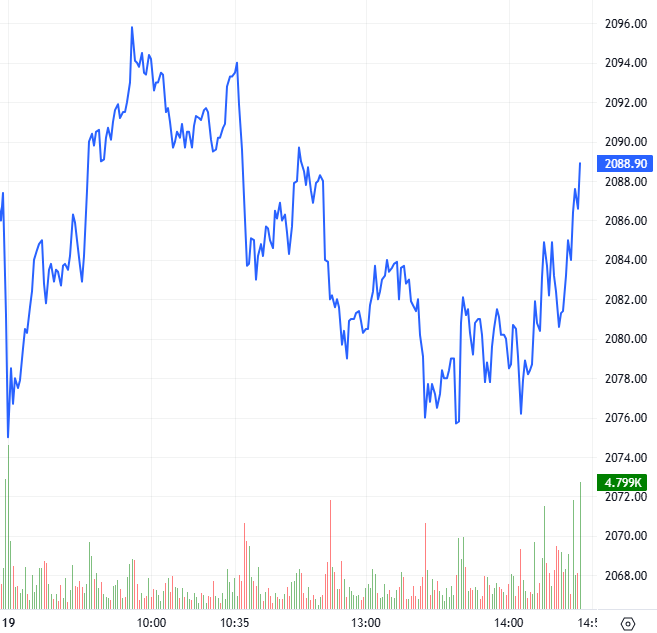
Source: https://stockchart.vietstock.vn
At the close, the basis of the I1G2000 contract reversed from the previous session, reaching -5.34 points. This indicates a return to bearish sentiment among investors.
Fluctuations of 41I1G2000 and VN30-Index
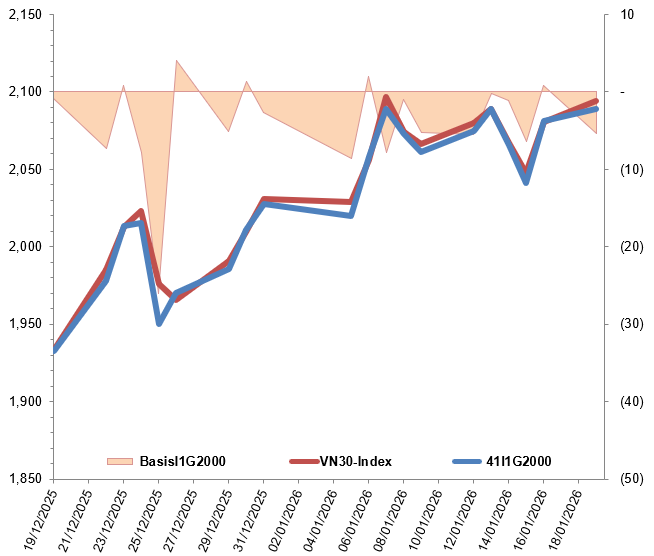
Source: VietstockFinance
Note: Basis is calculated as follows: Basis = Futures Contract Price – VN30-Index
Meanwhile, the basis of the I2G2000 contract also reversed, reaching -26.31 points, reflecting renewed investor pessimism.
Fluctuations of 41I2G2000 and VN100-Index
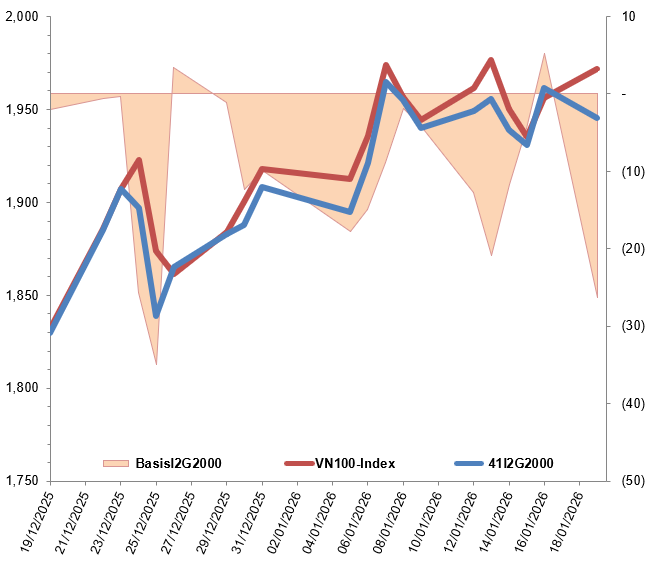
Source: VietstockFinance
Note: Basis is calculated as follows: Basis = Futures Contract Price – VN100-Index
Trading volume and value in the derivatives market decreased by 14.28% and 13.99%, respectively, compared to the January 16, 2026 session. Specifically, the trading volume of I1G2000 fell by 14.29%, with 237,082 contracts matched. The trading volume of I2G2000 dropped by 61.54%, with only 30 contracts matched.
Foreign investors continued to buy net, with a total net purchase volume of 522 contracts on January 19, 2026.
Daily Trading Volume Fluctuations in the Derivatives Market. Unit: Contracts
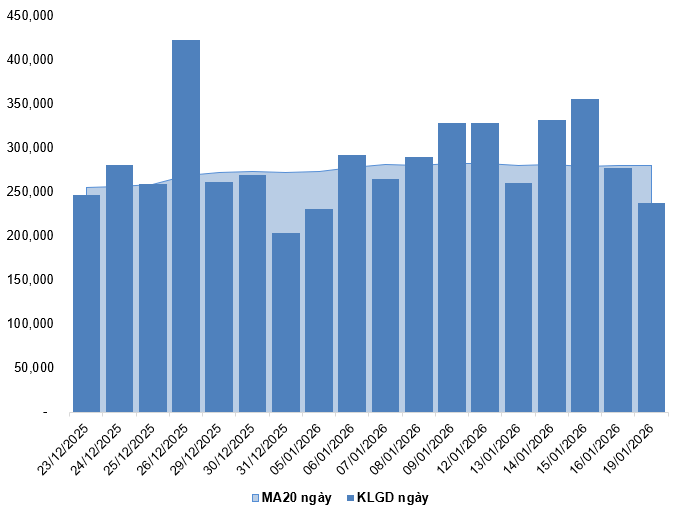
Source: VietstockFinance
I.2. Valuation of Futures Contracts
Based on the fair pricing method as of January 20, 2026, the fair price range for actively traded futures contracts is as follows:
Summary Table of Derivatives Valuation for VN30-Index and VN100-Index
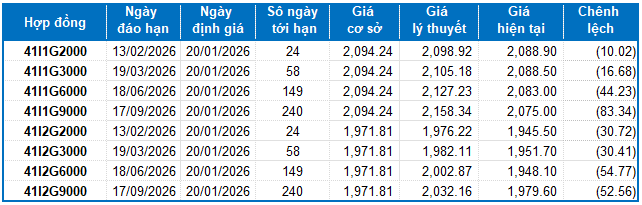
Source: VietstockFinance
Note: Opportunity costs in the valuation model are adjusted to suit the Vietnamese market. Specifically, the risk-free rate (government treasury bills) is replaced by the average deposit rate of major banks, with maturity adjustments for each futures contract.
I.3. Technical Analysis of VN30-Index
During the January 19, 2026 session, the VN30-Index rose, accompanied by a small-bodied candlestick pattern and a decline in trading volume below the 20-session average, indicating investor hesitation.
Currently, the MACD indicator continues to signal buying, while the index remains above the Bollinger Bands’ Middle line, suggesting a positive short-term outlook.
However, the Stochastic Oscillator is in the overbought zone. If a sell signal emerges and the indicator exits this zone in upcoming sessions, the risk of a correction will increase.
Technical Analysis Chart of VN30-Index
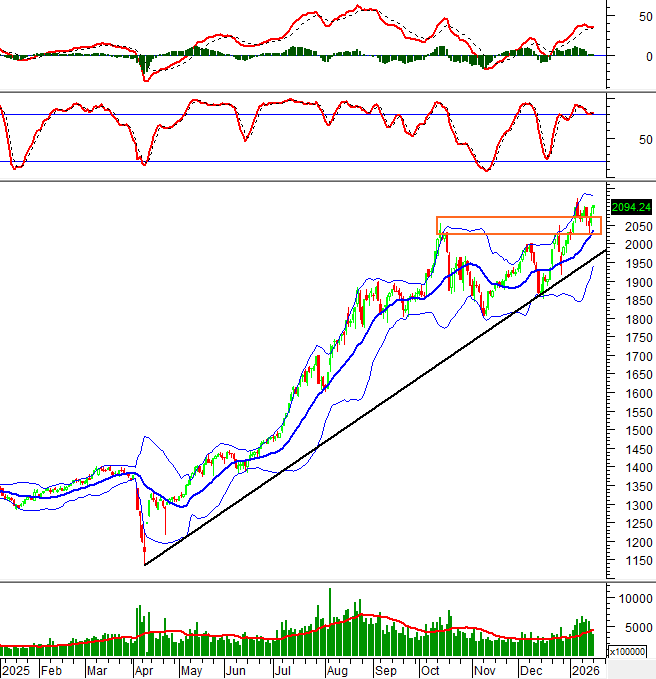
Source: VietstockUpdater
II. FUTURES CONTRACTS OF THE BOND MARKET
Based on the fair pricing method as of January 20, 2026, the fair price range for actively traded government bond futures contracts is as follows:
Summary Table of Government Bond Futures Valuation
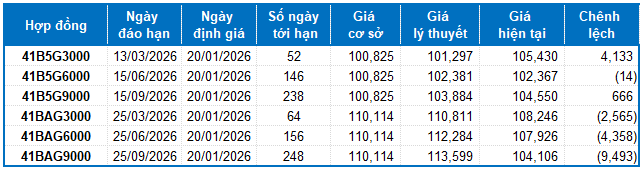
Source: VietstockFinance
Note: Opportunity costs in the valuation model are adjusted to suit the Vietnamese market. Specifically, the risk-free rate (government treasury bills) is replaced by the average deposit rate of major banks, with maturity adjustments for each futures contract.
According to the above valuation, contracts 41B5G6000, 41BAG3000, 41BAG6000, and 41BAG9000 are currently attractively priced. Investors should focus on and consider buying these futures contracts in the near term, as they offer excellent value in the market.
Economic Analysis & Market Strategy Department, Vietstock Consulting
– 18:28 19/01/2026
January 20, 2026: A Mixed Bag for Warrant Market as Green and Red Intersect

At the close of trading on January 19, 2026, the market saw 108 stocks rise, 142 fall, and 37 remain unchanged. Foreign investors continued their net selling streak, offloading a total of 1.21 billion VND.
Derivatives Market on January 28, 2026: Pessimism Persists

On January 27, 2026, futures contracts for the VN30 and VN100 indices predominantly closed lower. The VN30-Index marked its third consecutive session of decline, accompanied by the emergence of a Three Black Crows candlestick pattern, signaling persistent bearish sentiment among investors.
Derivatives Market on January 21, 2026: Intense Tug-of-War Dynamics Emerge

On January 20, 2026, the VN30 and VN100 futures contracts exhibited a mixed trading session, with alternating gains and losses. The VN30-Index closed lower, forming a small-bodied candlestick pattern accompanied by above-average trading volume over the past 20 sessions, indicating a cautious sentiment among investors.
Vietstock Weekly 19-23/01/2026: Tug-of-War at New Peak Levels

The VN-Index is experiencing intense volatility near its new peak, marked by the emergence of a Doji candlestick pattern. The medium-term uptrend remains intact as the index closely follows the Upper Band of the Bollinger Bands, while the MACD sustains its upward momentum following a buy signal. However, short-term volatility risks may rise as the Stochastic Oscillator enters overbought territory, indicating the index needs more time to consolidate at this new price level.
Foreign Blockades Unleash Massive Sell-Off: VN-Index Plunges 28 Points as Over 1.8 Trillion VND Floods the Market – Which Stocks Took the Biggest Hit?

Foreign investors’ transactions were a notable drawback, with a net selling value of approximately VND 1.834 trillion.


