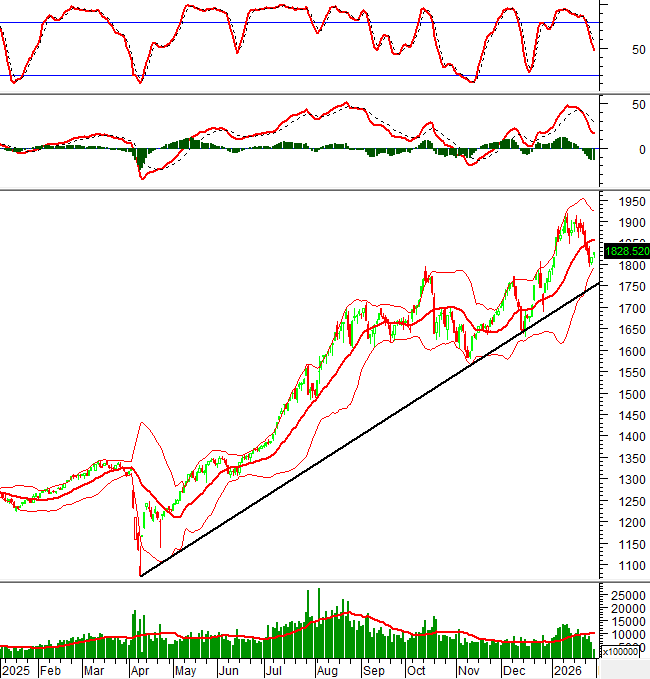
Technical Signals of VN-Index
During the morning trading session on January 29, 2026, the VN-Index continued its mild recovery and may test the Middle of the Bollinger Bands in upcoming sessions.
Trading volume has consistently remained below the 20-day average. This needs to improve in the coming period.
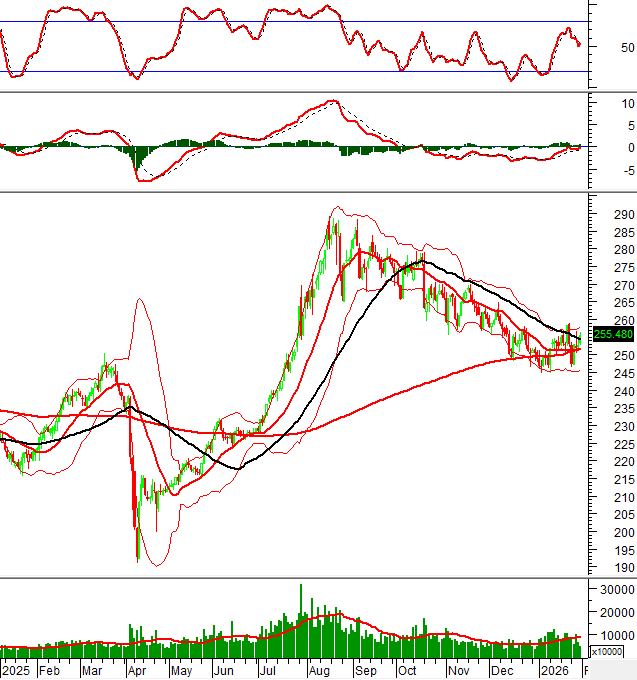
Technical Signals of HNX-Index
The HNX-Index successfully tested the previous bottom from January 2026 (equivalent to the 244-250 point range) and recovered well.
The MACD indicator continues to rise and may cross above the 0 threshold this week. The Stochastic Oscillator has reversed and is preparing to give a buy signal again.
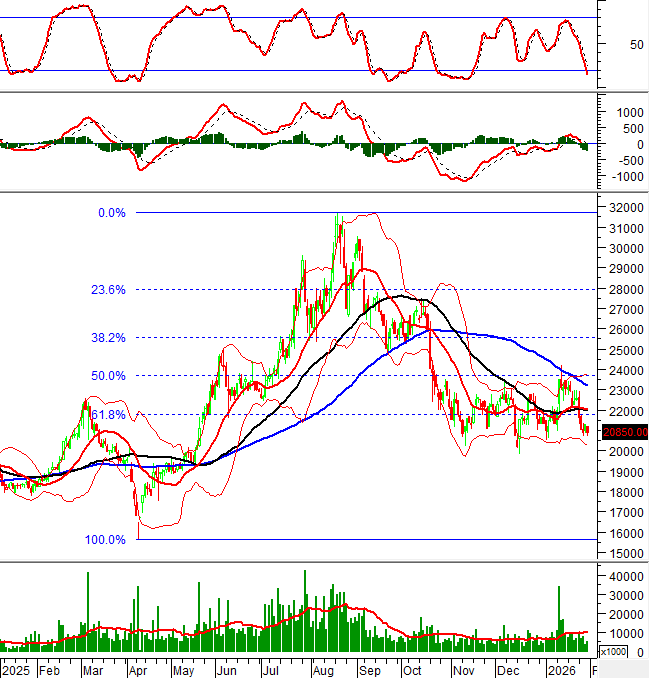
EIB – Vietnam Export-Import Commercial Joint Stock Bank
The share price of EIB declined during the morning of January 30, 2026, accompanied by higher trading volume compared to the previous session, indicating less optimistic investor sentiment.
Additionally, the price of EIB remains below the Middle of the Bollinger Bands, while the MACD indicator continues to decline after giving a sell signal. This suggests that negative prospects persist.
However, the Stochastic Oscillator has moved deep into the oversold region. If the indicator gives a buy signal and moves out of this region in the near future, the short-term outlook will become less negative.
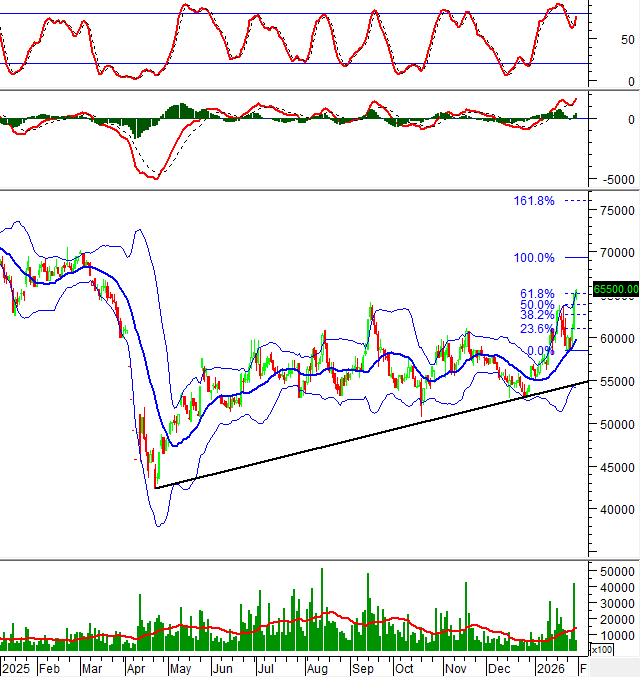
VHC – Vinh Hoan Corporation
The share price of VHC continued to rise during the morning of January 30, 2026, with the appearance of a Three White Soldiers candlestick pattern, reflecting optimistic investor sentiment.
Currently, the stock price has surpassed the 61.8% Fibonacci Projection level (equivalent to the 65,000-66,000 range).
Furthermore, the price of VHC continues to closely follow the Upper Band of the Bollinger Bands, while the MACD indicator is forming higher highs and higher lows. This indicates that the short-term outlook remains favorable.
(*) Note: The analysis in this article is based on realtime data as of the end of the morning trading session. Therefore, the signals and conclusions are for reference only and may change when the afternoon session concludes.
Technical Analysis Department, Vietstock Advisory Division
– 12:04 January 30, 2026
Technical Analysis for the Afternoon Session of January 29: A Tug-of-War

The VN-Index fluctuated and continued its downward trend, though without the sharp declines seen in previous sessions. Meanwhile, the HNX-Index found solid support at its January 2026 low, equivalent to the 244-250 point range.
Market Pulse 26/01: Foreign Investors Return to Net Buying, VN-Index Drops Over 27 Points

At the close of trading, the VN-Index fell by 27.07 points (-1.45%), settling at 1,843.72, while the HNX-Index dropped 5.66 points (-2.24%), closing at 247.3. Market breadth was overwhelmingly negative, with 548 decliners outpacing 188 advancers. Similarly, the VN30 basket saw red dominate, as 24 constituents declined and only 6 advanced.
Market Pulse 19/01: Foreign Investors Return to Net Buying in Large Caps, VN-Index Continues Its Rally

At the close of trading, the VN-Index climbed 17.46 points (+0.93%) to reach 1,896.59, while the HNX-Index rose 2.67 points (+1.06%) to 254.95. Market breadth was relatively balanced, with 344 gainers and 355 decliners. Within the VN30 basket, bullish sentiment prevailed, as 18 stocks advanced, 9 retreated, and 3 remained unchanged.
Vietstock Daily 27/01/2026: Widespread Selling Pressure Intensifies

The VN-Index plunged dramatically, forming a long red candle accompanied by trading volume surpassing the 20-day average, reflecting investors’ subdued sentiment. The index is currently retesting the Middle Band of the Bollinger Bands, while both the Stochastic Oscillator and MACD indicators continue their sharp decline following earlier sell signals.
Vietstock Daily 20/01/2026: Aiming for New Target Zones

The VN-Index regained its upward momentum towards the end of the session, forming a Long Lower Shadow candlestick pattern. In the near term, the index is targeting the 1,935-1,950 range, which aligns with the Fibonacci Projection level of 161.8%.


")