I. MARKET ANALYSIS OF THE BASE STOCK MARKET ON JANUARY 19, 2026
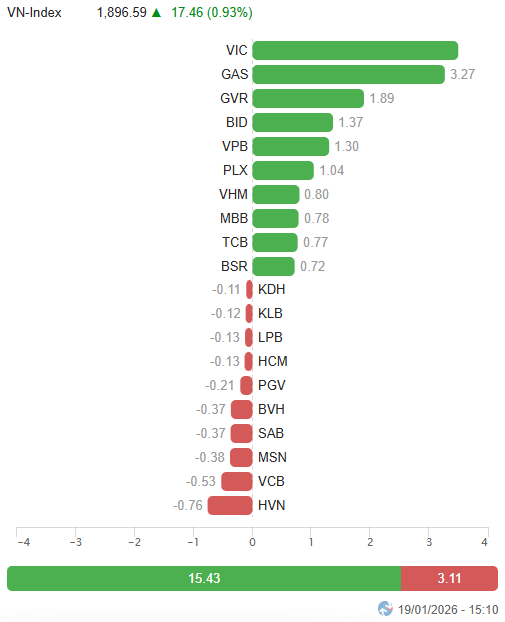
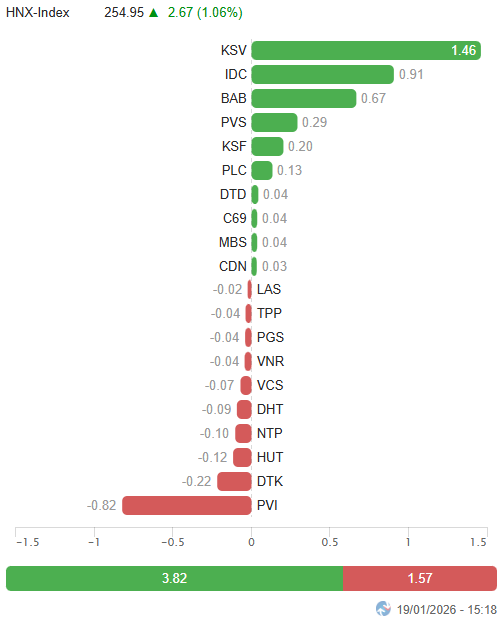
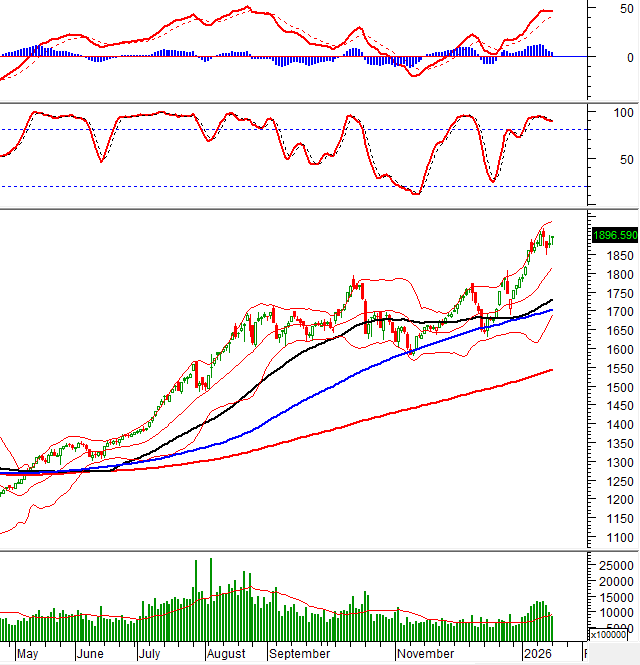
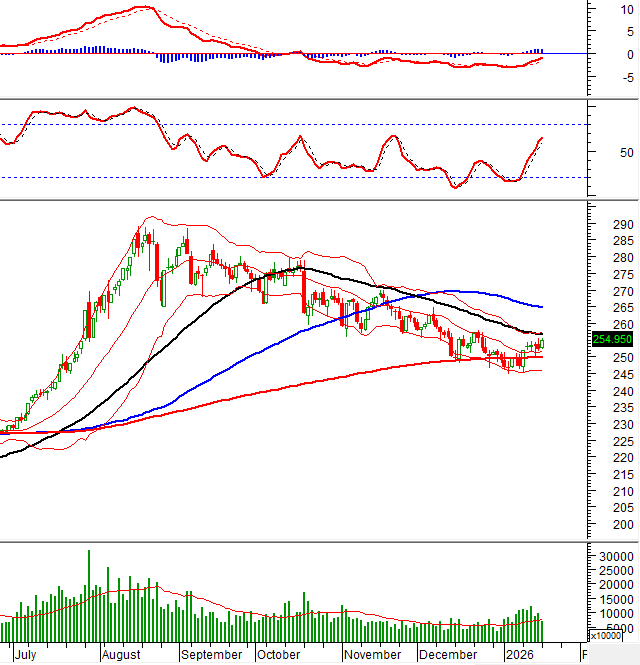
– Major indices unanimously gained during the January 19 trading session. The VN-Index rose by 0.93%, reaching 1,896.59 points, while the HNX-Index climbed 1.06% to 254.95 points.
– Trading volume on the HOSE floor decreased by 15.1%, totaling over 832 million units. The HNX floor recorded more than 69 million matched units, a 28% drop compared to the previous session.
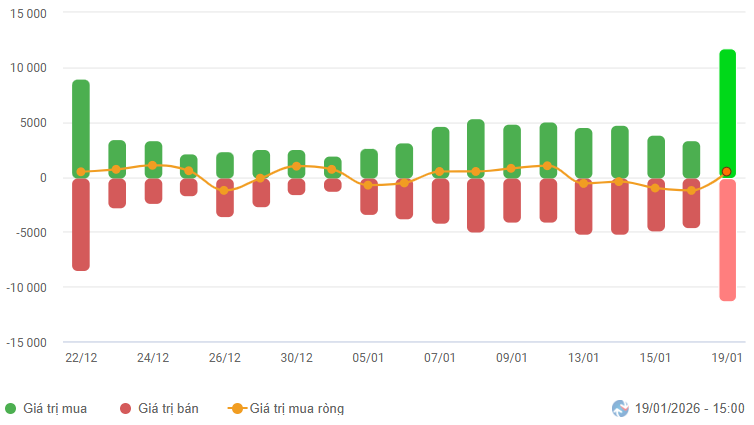
– Foreign investors returned to net buying with a value of nearly VND 515 billion on the HOSE floor but remained net sellers with approximately VND 8 billion on the HNX floor.
Foreign Investors’ Trading Value on HOSE, HNX, and UPCOM by Date. Unit: Billion VND
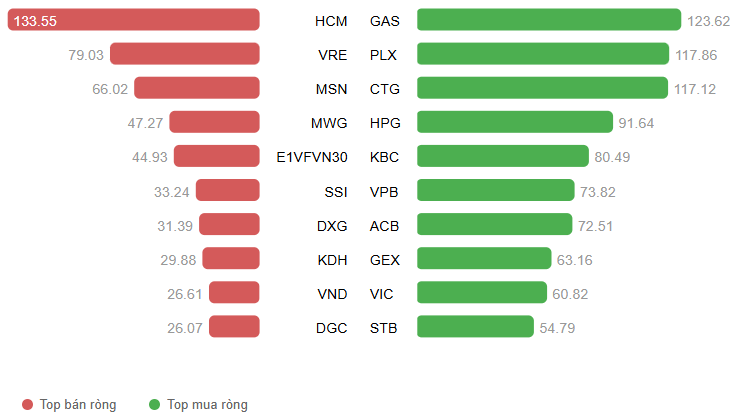
Net Trading Value by Stock Code. Unit: Billion VND
– The market began the January 19 session on a positive note, with the VN-Index swiftly advancing to the 1,895-point region. However, the upward momentum was significantly restrained by the weakening of large-cap stocks, causing the index to lose most of its morning gains and enter a state of fluctuation. In the afternoon session, improved demand for leading stocks helped the VN-Index recover and maintain its green status until the close. The index closed at 1,896.59 points, up 0.93% from the previous session.
– Among market capitalization groups, the rise was primarily driven by the VS-LargeCap group, while the VS-MidCap and VS-SmallCap groups fluctuated within a narrow range, reflecting continued widespread divergence.
– In terms of influence, VIC and GAS were the most positive contributors, each adding over 3 points to the VN-Index. They were followed by GVR, BID, and VPB, which collectively contributed 4.6 points. On the downside, the most significant pressure came from HVN and VCB, though their impact was modest, subtracting only about 1.3 points from the index.
Top Stocks Influencing the Index. Unit: Points
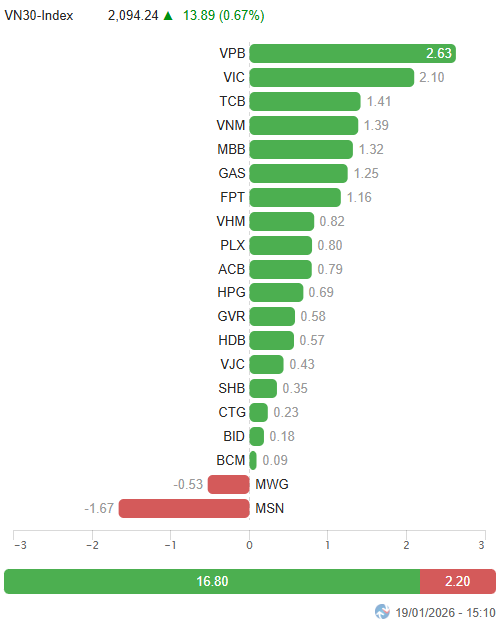
– The VN30-Index closed with a gain of nearly 14 points (+0.67%), reaching 2,094.24 points. The breadth was positive, with 18 gainers, 9 losers, and 3 unchanged stocks. Leading the gains was PLX with a notable purple status, followed by GAS and GVR, which surged 6% and 5.8%, respectively. On the downside, SAB faced the strongest adjustment in the basket, dropping 2.7%.
Green dominated most sectors. The communication services and energy sectors saw the strongest gains, with demand concentrated in large-cap stocks such as VGI (+4.39%), FOX (+12.4%); BSR (+3.23%), PVS (+2.6%), PVD (+1.38%), OIL (+2.74%), and PLX hitting the upper limit.
Additionally, large-cap sectors like real estate and finance traded actively, with highlights including VIC (+1.31%), BCM (+1.68%), KBC (+6.74%), PDR (+1.71%), VPI (+1.1%), TAL (+3.33%), SIP (+3.15%); BID (+1.76%), CTG (+1.01%), TCB (+1.4%), VPB (+2.6%), MBB (+1.66%), HDB (+1.05%), ACB (+1.01%), and VPX (+2.27%).
Conversely, the industrial sector saw the strongest adjustment, declining 2.26%. Selling pressure was concentrated in stocks like ACV (-3.72%), HVN (-4.07%), VEA (-6.73%), MVN (-14.21%), BMP (-2.13%), PHP (-3.53%), PC1 (-2.03%), and SJG (-2.91%). However, the sector still recorded some bright spots against the trend, such as GEX (+1.72%), VGC (+4.06%), CC1 (+4.33%), VCG (+1.29%), CII (+1.34%), and LGC hitting the upper limit.
The VN-Index regained its upward momentum toward the end of the session, forming a Long Lower Shadow candlestick pattern. In the short term, the index is targeting the 1,935-1,950 point region (equivalent to the 161.8% Fibonacci Projection).
II. PRICE TREND AND VOLATILITY ANALYSIS
VN-Index – Long Lower Shadow Candlestick Pattern Emerges
The VN-Index regained its upward momentum toward the end of the session, forming a Long Lower Shadow candlestick pattern.
In the short term, the index is targeting the 1,935-1,950 point region (equivalent to the 161.8% Fibonacci Projection).
HNX-Index – Big White Candle Pattern Appears
The HNX-Index rebounded with a Big White Candle pattern.
The short-term positive outlook is reinforced as both the Stochastic Oscillator and MACD indicators continue to rise after giving buy signals.
The 50-day SMA will be a critical challenge for the index in the coming sessions.
Capital Flow Analysis
Smart Money Flow Dynamics: The Negative Volume Index of the VN-Index is above the 20-day EMA. If this condition persists in the next session, the risk of a sudden downturn (thrust down) will be mitigated.
Foreign Capital Flow Dynamics: Foreign investors were net buyers in the January 19, 2026, trading session. If foreign investors maintain this action in the upcoming sessions, the outlook will remain optimistic.
III. MARKET STATISTICS FOR JANUARY 19, 2026


