


: Has the Year of Defense Arrived?")


: Mixed Signals Emerge")
I. MARKET ANALYSIS OF THE 28/01/2026 SESSION
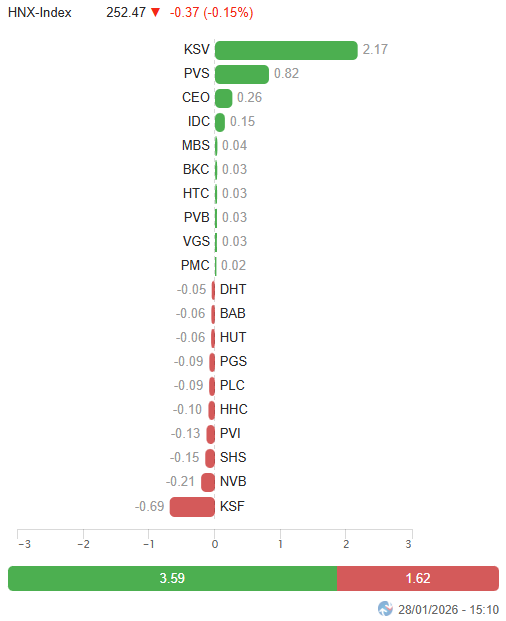
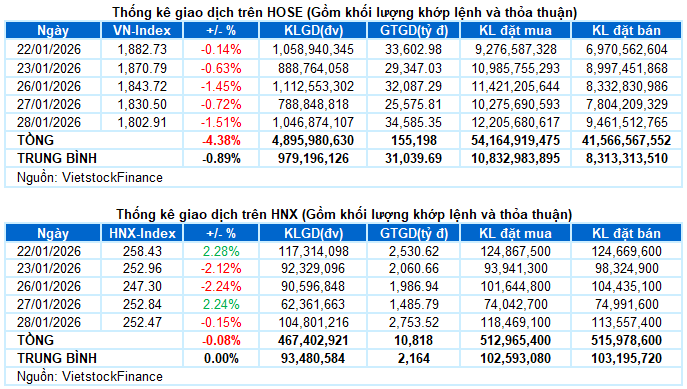
– Major indices experienced a collective decline during the January 28th trading session. The VN-Index continued its downward trend, shedding 1.51% to close at 1,802.91 points. The HNX-Index saw a slight decrease of 0.15%, settling at 252.47 points.
– Trading volume on the HOSE floor surged by 14.8%, surpassing 863 million units. The HNX floor recorded over 101 million matched orders, a significant 69.8% increase compared to the previous session.
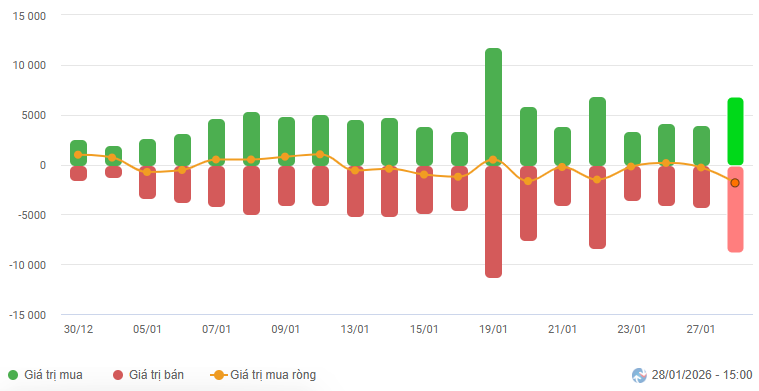
– Foreign investors intensified their net selling activities, with a value exceeding 1.5 trillion VND on the HOSE floor, while turning to net buying of 20 billion VND on the HNX floor.
Foreign Investors’ Trading Value on HOSE, HNX, and UPCOM by Date. Unit: Billion VND
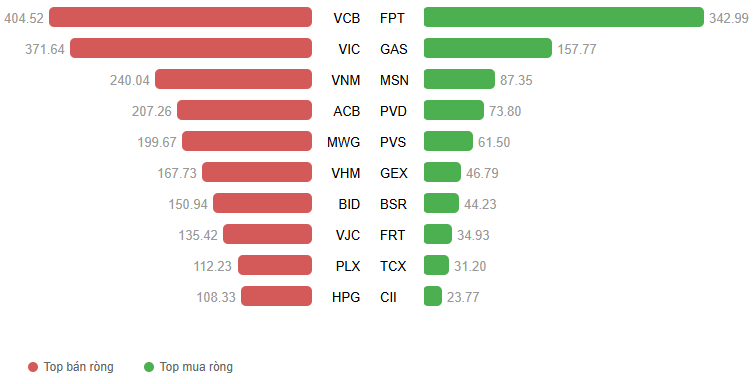
Net Trading Value by Stock Code. Unit: Billion VND
– The market faced intense adjustment pressure during the January 28th session as blue-chip stocks, particularly those from the Vingroup family, weakened from the outset, dragging the VN-Index into a continuous downward spiral, nearing the 1,800-point threshold in the morning session. Despite the absence of widespread panic selling and a not-too-negative market breadth, the weight of large-cap stocks coupled with aggressive net selling by foreign investors made it challenging for the index to find support. In the afternoon session, the VN-Index experienced a brief technical rebound as bottom-fishing demand emerged around lower price levels, temporarily lifting the index from its intraday lows. However, the inflow of capital remained tentative, and selling pressure quickly resurfaced in leading stocks, causing the index to weaken again towards the close. The VN-Index extended its losing streak to seven consecutive sessions, ending at 1,802.91 points.
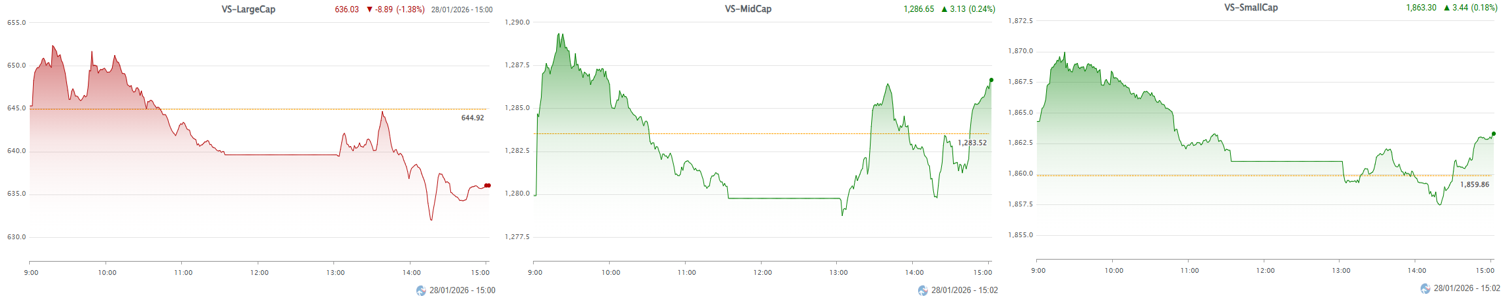
– Among market capitalization groups, adjustment pressure primarily concentrated on large-cap stocks, with the VS-LargeCap index declining sharply by 1.38%. In contrast, mid and small-cap stocks maintained a more positive stance, exhibiting mixed but slightly bullish movements, indicating a shift in capital flow away from blue-chip stocks towards lower-priced opportunities.
VS-MarketCap Index Performance
– In terms of impact, the top 10 negatively influencing stocks collectively deducted over 30 points from the VN-Index, with the duo VIC and VHM exerting the most significant pressure, reducing the index by nearly 22 points. Conversely, support for the index was limited, with GAS, MSN, and FPT leading but only contributing a combined 3.32 points.
Top Influencing Stocks on the Index. Unit: Points
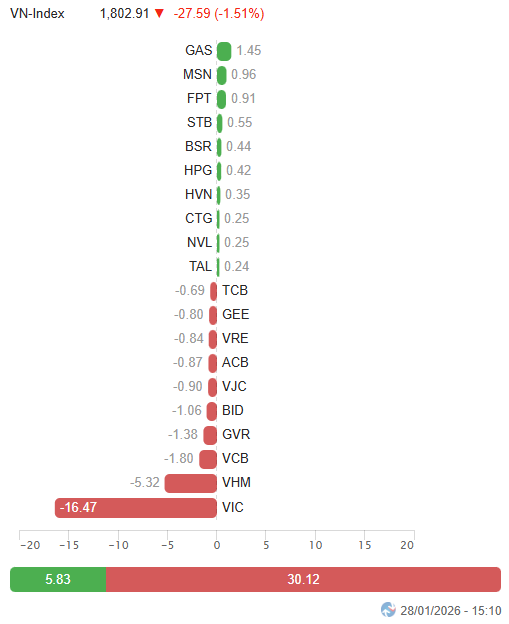
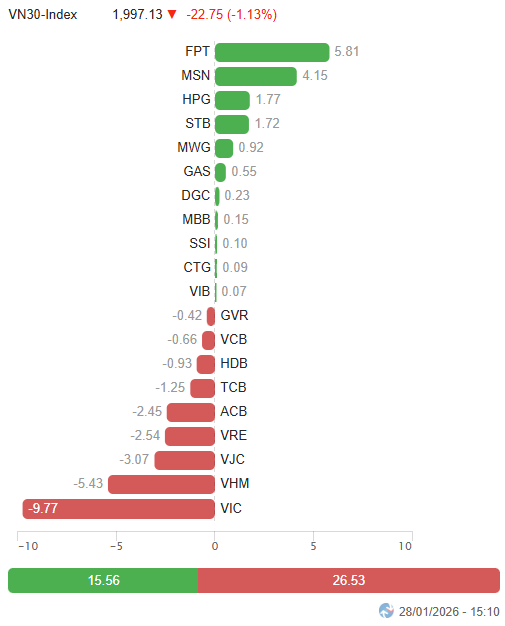
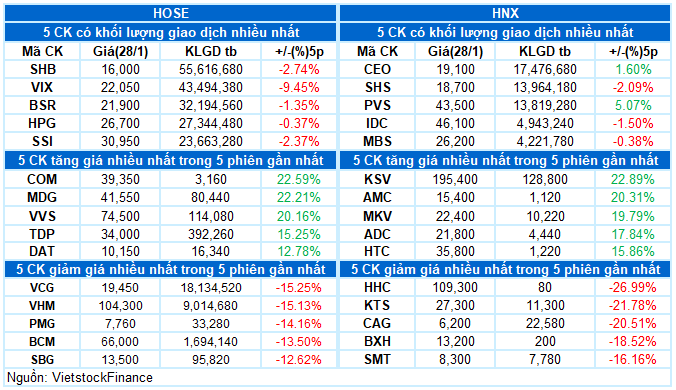
– The VN30-Index fell by 22.75 points (-1.13%), closing at 1,997.13 points. Market breadth was relatively balanced, with 16 decliners, 11 advancers, and 3 unchanged stocks, although deep losses in the largest-cap stocks dictated the overall trend. Vingroup-related stocks remained under negative spotlight, with VIC hitting the lower limit, VRE losing 5.8%, and VHM declining by 5.7%. Additionally, VJC and GVR also saw significant adjustments of around 4%. On the positive side, MSN, FPT, GAS, and STB maintained positive demand, leading with gains above 2%.
Mixed trends continued to dominate industry groups. The real estate sector index experienced the deepest decline, heavily influenced by the Vingroup trio. Nonetheless, demand emerged in some counter-trend stocks such as CEO (+4.37%), DIG (+2.24%), IDC (+1.54%), DXG (+1.33%), TCH (+6.16%), HDC (+2.38%), and NLG (+3.39%).
Financial and industrial sectors also exerted considerable pressure on the market, with numerous stocks declining over 1%, including VCB, BID, TCB, HDB, ACB, VIX, VCI; VJC, GEX, GEE, VCG, HAH, BMP, and CTD. However, capital found support in select stocks like STB (+2.1%), VPX (+1.83%); ACV (+3.12%), HVN (+1.94%), VGC (+2.44%), and CII (+5.8%).
Conversely, information technology, energy, and essential consumer sectors stood out as bright spots, driven by positive contributions from FPT (+2.35%), ELC (+1.66%), DLG (+4.48%); PVS (+6.62%), PVD (+4.1%), OIL (+4.14%), PVT (+2.19%), BSR (+1.86%); MSN (+3.65%), MML (+5.23%), HNG (+4.55%), VHC (+4.27%), ANV (+1.31%), and MPC (+3.18%).
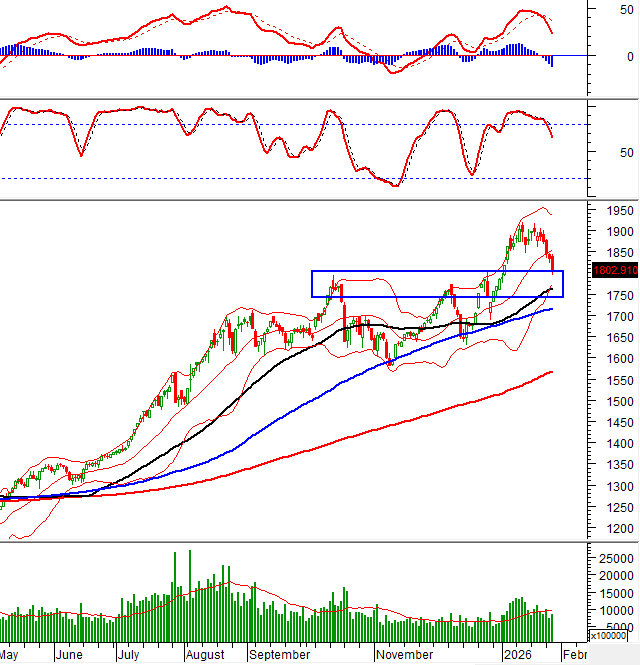
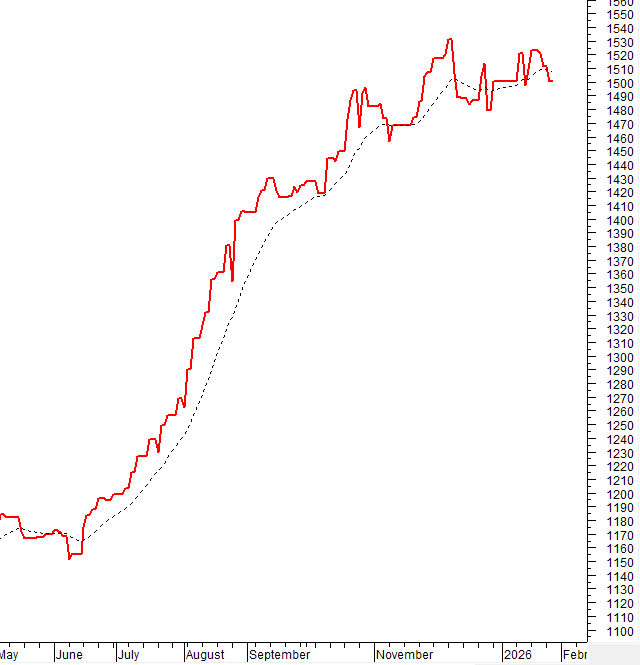
The VN-Index continued its steep decline, forming a Big Black Candle pattern, and is poised to retest the SMA 50 day line. This critical support level will determine the index’s trend in the coming period.
II. TREND AND PRICE VOLATILITY ANALYSIS
VN-Index – Poised to Retest the SMA 50 Day Line
The VN-Index continued its steep decline, forming a Big Black Candle pattern, and is poised to retest the SMA 50 day line. This critical support level will determine the index’s trend in the coming period.
Short-term risks are escalating as the Stochastic Oscillator and MACD indicators maintain their downward trajectory after issuing sell signals.
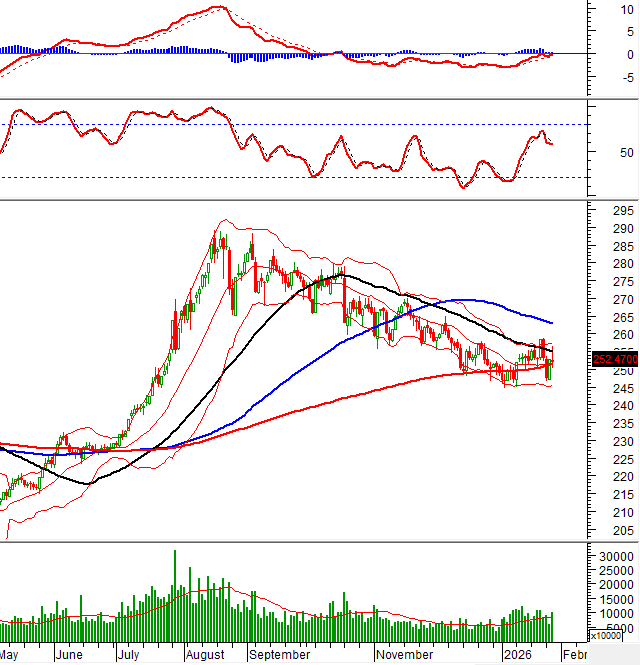
HNX-Index – Formation of a Long Upper Shadow Candle
The HNX-Index experienced a slight decline following a tug-of-war session, forming a Long Upper Shadow candle, indicating that the SMA 50 day line remains a challenging resistance in the short term.
On the other hand, the January 2026 low (equivalent to the 244-250 point range) is providing solid support for the index, and the MACD indicator has not yet issued a sell signal, suggesting that the risk of a deep correction is not high.
Capital Flow Analysis
Smart Money Movement: The Negative Volume Index of the VN-Index is currently below the EMA 20 day line. If this condition persists in the next session, the risk of a sudden downward thrust will increase.
Foreign Capital Movement: Foreign investors were net sellers in the January 28th session. If overseas investors continue this action in upcoming sessions, the outlook will become even more pessimistic.
III. MARKET STATISTICS FOR JANUARY 28, 2026
Economic & Market Strategy Analysis Department, Vietstock Consulting Division
– 17:18 28/01/2026
Technical Analysis for the Afternoon Session of January 30: Continued Recovery

Despite low trading volumes, the VN-Index continues its modest recovery and may retest the middle band of the Bollinger Bands in upcoming sessions. Meanwhile, the HNX-Index successfully tested its January 2026 low (around 244-250 points) and has shown a strong rebound.
Technical Analysis for the Afternoon Session of January 29: A Tug-of-War

The VN-Index fluctuated and continued its downward trend, though without the sharp declines seen in previous sessions. Meanwhile, the HNX-Index found solid support at its January 2026 low, equivalent to the 244-250 point range.
Market Pulse 26/01: Foreign Investors Return to Net Buying, VN-Index Drops Over 27 Points

At the close of trading, the VN-Index fell by 27.07 points (-1.45%), settling at 1,843.72, while the HNX-Index dropped 5.66 points (-2.24%), closing at 247.3. Market breadth was overwhelmingly negative, with 548 decliners outpacing 188 advancers. Similarly, the VN30 basket saw red dominate, as 24 constituents declined and only 6 advanced.
Market Pulse 19/01: Foreign Investors Return to Net Buying in Large Caps, VN-Index Continues Its Rally

At the close of trading, the VN-Index climbed 17.46 points (+0.93%) to reach 1,896.59, while the HNX-Index rose 2.67 points (+1.06%) to 254.95. Market breadth was relatively balanced, with 344 gainers and 355 decliners. Within the VN30 basket, bullish sentiment prevailed, as 18 stocks advanced, 9 retreated, and 3 remained unchanged.
Vietstock Daily 27/01/2026: Widespread Selling Pressure Intensifies

The VN-Index plunged dramatically, forming a long red candle accompanied by trading volume surpassing the 20-day average, reflecting investors’ subdued sentiment. The index is currently retesting the Middle Band of the Bollinger Bands, while both the Stochastic Oscillator and MACD indicators continue their sharp decline following earlier sell signals.


